• توجه: در صورتی که از کاربران قدیمی ایران انجمن هستید و امکان ورود به سایت را ندارید، میتوانید با آیدی altin_admin@ در تلگرام تماس حاصل نمایید.

فاکتورهای مهم در شکل گیری پدیده طوفان و رعد و برق

Amir Mohsen

متخصص بخش هواشناسی
Severe Weather Season And What You need to Know

Now that winter has taken a backseat and is slowly transitioning to Spring within the next couple of weeks, we are going to brief you on the basics of severe weather. We will give mention to topics and terms used in this educational update throughout the times when severe weather is possible and the common case of Spring fever and it’s severe weather setups across the country.

-mjAoYLkdDn3YrOPgv2KhID5QtlktpYE8Ty4WBpVz6xnjisIkU79SLluPfhsY64iK_tEMzIZu7Bdiq9m_iEw4m-JD-ogqOGVeHTksPVoET1d3ua-AbGTMc5Txw

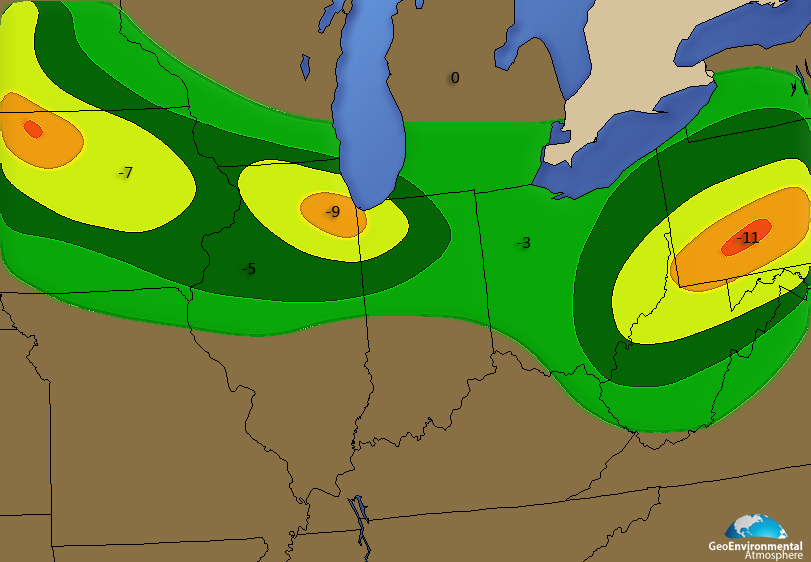
Figure 1: We find towards the transition from Winter to Spring that lingering cold air adds as an ingredient to newly accompanied warmer air to produce spawning severe weather where colliding air masses meet. This is common over the Midwest, Deep South, Southeast, and Mid-Atlantic. This of which we will illustrate throughout the post.​
In this figure and applied to also figures (2,3) the red signifies our warmer sector(s) while blue indicating our colder sector. Between in the pink sits the jet stream thus our frontal position and setup. One of first common setups this earlier Spring exists in the following figure and ripe for tornadoes from the Southern Plains, Deep South, and Tennessee Valley shown in figure 1. The trough is not as deeply dug but the equaling constant of both air masses makes of these impressive and large outbreaks.
In a synopsis form we would best describe this as ”having a cold air mass located to the north and a warmer air mass that is attempting to invade the region via transport from the low pressure system and its associated warm front. As the two air masses clash, their convergence results in an explosion of convection, thus producing thunderstorms. In general, the bigger differential the two air masses are in temperature, the stronger the thunderstorms are. The low pressure then moves Northeast towards the Great Lakes or into the Northeast, dragging its thunderstorms across the Eastern half of the country. “

Deep South Threats
f781HFEg8OZJ4r4M02FKBdoweeQFdLFvzjzKxUx4kGGKuycox6RclRmUCn3NpvU11lb7sQLg2hUOlQh8V6-ey-wfQAT4EiwcWxDB5ZCsBtkit4p29zeG3QylHg

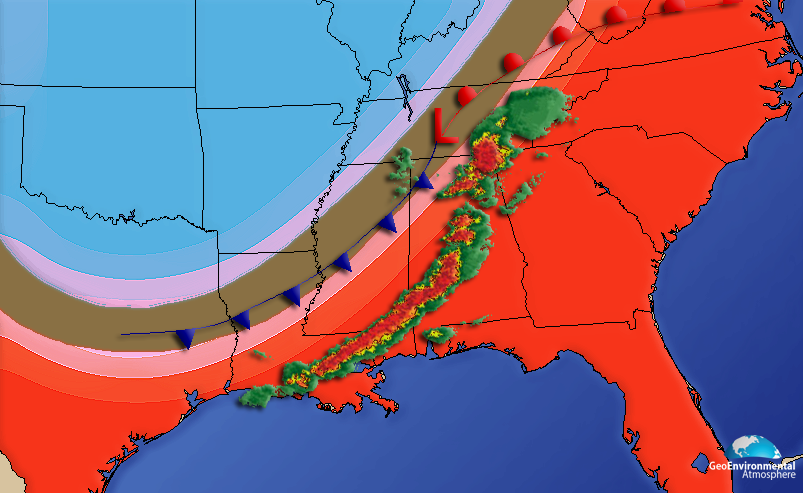
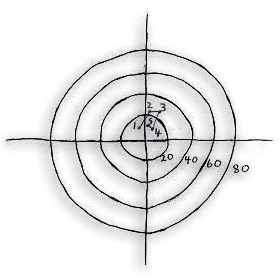
Figure 2: Another setup shown in this figure comes from a deeper dug trough out of the West which pushes into warmer air squeezing and disturbing the atmosphere while creating that same constant mixing of warmer and colder air. We also especially in this region mention the juicier atmosphere because of the water bodies of the Gulf and Southeast coast which contribute to developing storms. Normally in this general setup we find linear storm producing tornadoes but most likely strong wind damage and heavy flash flooding.​
Mid-Atlantic & Northeast Threats

fnTeQuh6VaB0DYhj1aC9pJEy5o_uB7WT76iNSTOBNFFnC9Gui4nEc4EdN2A33lQLbkDHTHBSJjYEBPLY45clj9m0FkIT9hgYRu7n0DtCnwOBr9vcWdetwXThNA
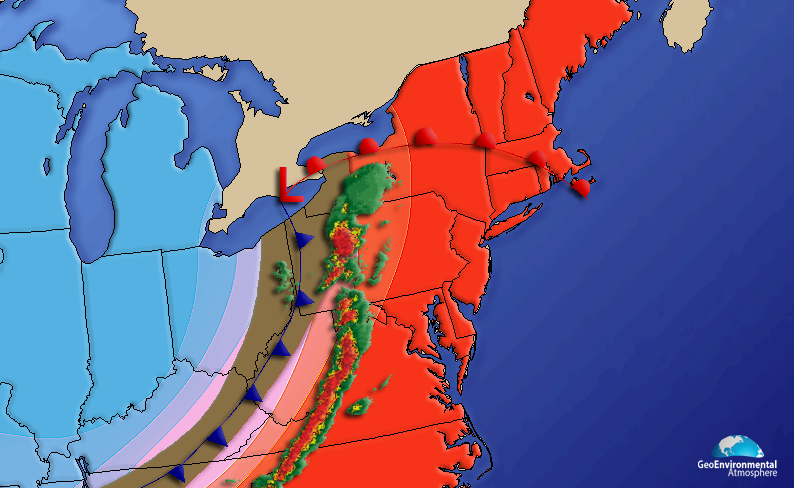
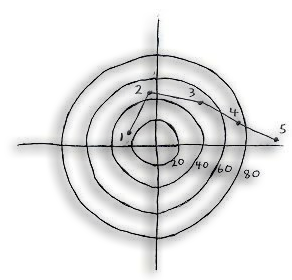
Figure 3: Here another previewing stormy setup though this time over the Mid-Atlantic and Northeast. This is very common during all parts of the season as we like to call it the normal frontal setup where a heaving cold front from the West hooks up with a warmer and moist air mass from the South and East to develop strong storms ahead of the front. This common for linear storms and some super celled.​
Know The Lingo
The thermodynamic parameters that will be explained and defined are the following in this section. They are all very important to the development of convective systems. If you take the time to read and educate yourself, you will be much more prepared to comprehend our updates, not to mention actually knowing what reasoning we use when forecasting a severe weather setup. There are a few definitions and terms that we must go over, to make the update easier to understand.
(Please be advised that this is a conceptual outlook on the basic ingredients of severe weather, and that more parameters aid in defining the severe weather threat and intensity).
 

Amir Mohsen

متخصص بخش هواشناسی
Parcel - When we give mention to a parcel, all that we mean is a concentration of air. Think of the air inside of a balloon. Now, imagine that air but without the balloon’s skin. The air inside the balloon is the parcel of air.

Buoyancy and density - Buoyancy is everything in severe weather. It is important because air at a higher temperature is more buoyant and less dense. It can ascend through the atmosphere higher since it is lighter than colder air. Although this is a very drastic example, think of the warmer air as helium, and the colder air as oxygen. The less dense gas (helium) rises through the denser air (oxygen).

Lifted Condensation Level (LCL)
To start, a water vapor condenses when the temperature of the water vapor (or air parcel) matches a specific dewpoint. The Lifted Condensation Level (LCL) is the level in the atmosphere where a rising air parcel condensed, and forms the base of a cloud. The rising air cools at specific rates that are defined by several atmospheric parameters. They are called lapse rates. The steeper the lapse rate is, the faster the air parcel cools and condenses, and the lower the cloud base is. When there are steep low level lapse rates, the atmosphere is said to be unstable, and the cloud base forms closer to the ground. On the contrary, when the air parcel does not cool significantly with height, the atmosphere is stable, and there is an unfavorable environment for severe weather since the cloud base will be sufficiently higher than the low level lapse rates setup. The LCL is very important because one can estimate the instability of the low level atmosphere by just noting how close the cloud forms to the ground.

Convective Available Potential Energy (CAPE)
Don’t let the name scare you. Conceptually, CAPE is the amount of buoyant (or rising energy) that a parcel of air has. It is measured in Joules per Kilogram (J./Kg.), which is basically the amount of energy (given in Joules), per mass (kilogram) of air. If there is a lot of CAPE, an air parcel will rise faster through its environment and therefore create a bigger cloud as it is able to shoot higher up into the atmosphere before it loses its buoyant energy. If there is a low amount of CAPE, then the thunderstorm will not have a lot of energy and will be generally be smaller and weaker in size and intensity respectively.

ZXArZr62PsVW8EGJiHj2cuL6L0jSlLdIFvqlgcrAS3T-hG7sw52m_VlKqmhvLzMIaCHpHTNLh5W9yGmBxXuvKnUFaqDWkqwAEda9DOcqzuYhjpfcz9YTUm-Y

Figure 4: In a series of figures below we start with this current figure which illustrates in color and value CAPE. The higher the CAPE value the better instability exists to produce severe thunderstorms. In this figure the best likelihood for severe storms would lie around 1200-1600 J/kg or 1600-2000+ J/kg.​
Lifted Index (LI)

The Lifted Index is the temperature difference between the modeled temperature (produced by following various adiabatic lapse rates along the forecast soundings) and the actual (environmental) temperature. The bigger the difference (Ex. -10 C), the more unstable the atmosphere is. The warmer the rising parcel of the air (the more buoyant it is to its surroundings), the more unstable the atmosphere is.
Take the following example. At a specific air parcel rises, the modeled temperature says that its temperature should be at +10 C. It however, is at +17 C. The parcel then has more buoyant energy, and is able to rise farther up into the atmosphere than the colder air. It has a lifted index value of “-7”. (modeled temperature – environmental temperature). This is what is referred to as a negative lifted index value, and it a LI value of -7 would be supportive of strong to severe thunderstorms.

3OdOdOHja93fnHwvwRjUsfBjGC6lRtz9xRorO10QEbg1PnOF5V5auSGfOHSse9VWyQkLvQcv5UMfBhosfDDvpdBNoy2ikj92mRv2Odte8Wm-lH8DEVEzTzm2cA

Figure 5: Here we have placed lifted index values from (0) to negative values. As explained the the more negative the value presented the better chance for lift in the atmosphere, hence bettering for thunderstorm development. Note: Thunderstorms can approach cloud tops of well over 40,000 thousand feet and lift is a very important factor we must take into account.​
Helicity
Helicity is the amount of corkscrew motion that the atmosphere produces. It is heavily influenced by the differences in the direction and magnitude of wind in the troposphere (this is assuming that speed shear favors severe weather). Simply, a large differential in the directions of winds in a very short distance will produce more helicity. High values of helicity will tend to aid in the rotation of the mesocyclones (rotating column of air in a thunderstorm). This concept will be explored more in-depth below.

-wVUACv_bqw3sPat9q9tJlj74XSZSbXIDy8hfdAeGicgUjS0BS6i9ZSKE5tvajuS-MwbZMD3Ob04YZo3YeFT0zzUyC6mqbPZDrFjfV7wJFqVwVw7qvZYOA4Ldw

Figure 6: Helicity another major contributor to severe weather and especially tornadoes. Where the value is high we find the best shear and corkscrew motion to produce bettering signatures to rotating storms.​


Amir Mohsen

متخصص بخش هواشناسی
Speed and Directional Shear and Common Hodographs
There are four basic combinations of speed and directional shear that are commonly observed and produce severe weather. The combinations are consisted of two types of shear. Shear is simply the difference between two similar observations. In severe weather, we pay close attention to the “speed shear” and “directional shear” of a given atmospheric setup
Speed shear is the difference in wind speed that the atmosphere changes between two points, or heights. For example at the surface, the wind may be light at 3 knots, however at 900 Millibars, (2,500 feet in the atmosphere) the wind may be strong at 55 knots. Thus, the net change would be (55-3) to equal a speed shear value between the two layers to be 52 knots.
Directional shear is the change in wind direction between two points. In an example, at the surface the mean wind direction may be from the southwest, at 235 degrees. However at 2,500 feet it may be from the east at 90 degrees. To have a healthy severe thunderstorm, a finite combination of speed and directional shear must be present.
These will be explained in detail below:

1.) Weak Speed Shear – Weak Directional Shear
First, you are probably wondering “how do I read this thing?” Not to fear. Although intimidating, the hodograph is very easy to comprehend once you know how to read it.
The circular shape represents the 360 degrees that wind cal travel in. It is “sliced” into four main sections, each indicating North, East, South, or West.
(Note as these are just examples, no set orientation of the hodograph nor quantitative values of the degree measurements are given).

The small numbers, (1,2,3,4,5) are the measurements of the speed shear and the directional shear at given heights.

For example, “1″ may be read at 900 Millibars (2000 feet), and read (55kts @ 125 degrees).

The values (20, 40, 60, etc…) represent equal values of wind speeds for any degree of measured wind speed.

HIJXh4BtJIyOvrByrPEJXFcA5jr7nV8KkiimF9Cc1GD6_vDInQHXME5rxTNk4R-Y2Nd-G-8Y-KFJJFCr0FhcHZCA1BVUmxApLws2QbfvkZC6SqcfP-_w1Kc_Wg

Figure 7: This figure shows the hodograph for weak speed shear – weak directional shear​
We see that there is little speed or directional shear in the hodograph above, so lacking the two suggests that this setup will most likely produce a weak, short lived thunderstorm that will be of weak to moderate strength.

2.) Strong Speed Shear – Weak Directional Shear

2ArEuMapUESsq11IghxZXwLsj3Q2-b8anwdzBQHvOic_Z9_pogtZiu5UKN9cQZR9gUQxa0iWQ0engi7FWaFDFupvv7AVgWyBipq8Br6lADt1F2EOBLcx6z83_g

Figure 8: This figure shows the hodograph for strong speed shear – weak directional shear​
In a situation where there is strong speed shear and weak directional shear, the thunderstorm certainly is being prevented from collapsing on itself. However, it is getting sheared apart by the strong winds from level to level. This setup produces short lived thunderstorms that are often not severe, and carry small hail as well as the threat for heavy rain.

3.) Strong Speed Shear – Strong Directional Shear

TlQLABq7eFg_n4DylNkTD6YwfNrZWOYBI4Sonkp4ht5pdvLsIfnLBsI1h8_lS4w3uC7BT7qQSTn9POVtmQx2w32IEbA_9as7FMxYLf-YSG2-Ano-dbzaYRoCiw

Figure 9: This figure shows a hodograph for strong speed shear – strong directional shear​
If you see this setup, watch out! This is a prime setup for dangerous supercells as well as tornadoes. The thunderstorm is well ventilated as well as a strong rotating mechanism defined by the strong directional shear. This setup also is the most likely to produce large hail, and damaging winds at the surface.
 

Amir Mohsen

متخصص بخش هواشناسی
The History Is Shown
No matter how much a service puts forth the time to forecast severe weather, issue watches and warnings and keep people safe there will never be a way to actually stop severe weather from happening, this is where we need your help! Become a chaser or spotter and send the latest observations to your local service stations so all can be made more aware of the situations to better forecasting today and of the past 10, 20, to over 50 years.

Td8bgWwWD8L7oa2X0u_l7AJxFO5yGN-nSVzqxoUmEdl5bQuy8sto5V8HfVP0ONi-HxeWyZwh7XI56Vew-AoLDPMo3iIetrerBVt_MnCRch7jbLadW0H9vxy5MA

Figure 10: We can view from the figure the totals accounts of severe weather from 2011 to 2001. The numbers are high and yet expected each year to be so. (dailykos.com)
 

Amir Mohsen

متخصص بخش هواشناسی
SEVERE WEATHER INDICES PAGE
METEOROLOGIST JEFF HABY
TOTAL TOTALS


<44Convection not likely
44-50Likely thunderstorms
51-52Isolated severe storms
53-56Widely scattered severe
>56Scattered severe storms

[TD]
SPEED SHEAR


0-3Weak
4-5Moderate
6-8Large
8+Severe
[/TD]


K INDEX


15-25Small convective potential
26-39Moderate convective potential
40+High convective potential

[TD]
CAPE


1 - 1,500Positive
1,500 - 2,500Large
2,500+Extreme
[/TD]


SWEAT


150-300Slight severe
300-400Severe possible
400+Tornadic possible

[TD]
SR HELICITY


150-300Possible supercell
300-400Supercells favorable
400+Tornadic possible
[/TD]


LIFTED INDEX / SWI


-1 to -4Marginal instability
-4 to -7Large instability
-8 or lessExtreme instability

[TD]
BRN


<45Supercells favorable
<10Too sheared
teensOptimum
[/TD]


EHI


EHI >1Supercells likely
1 to 5F2, F3 tornadoes possible
5+F4, F5 tornadoes possible


NOTES:

*
Max uvv = square root of 2 × CAPE
*

[URL="http://www.theweatherprediction.com/habyhints/315/"][COLOR=#0000cd]BRN (Bulk Richardson Number)[/COLOR][/URL][COLOR=#000000]

= CAPE / (0-6 km) Shear
*
Showalter (SWI) = used when elevated convection is most likely (cool season)
*
EHI = (SR HEL × CAPE) /160,000
*
SWEAT = 12(850Td) +20(TT-49) +2(V850) + (V500) +125(sin(dd500-dd850) + 0.2)
*
Total Totals = (T850- T500) + (Td850 - T500)= vertical totals plus cross totals
*
K index = (T850 -T500) + (Td850 - Tdd700)
*SR
Helicity : determines amount of horizontal streamwise vorticity available for storm ingestion
*streamwise = parallel to storm inflow
*Important to look for thermal and dewpoint ridges
(THETA-E)
*For tornado, inflow must be greater than 20 knots
*20 to 30% of mesocyclones produce
tornadoes
*Tornado types: rope, needle, tube, wedge
*Look for
differential advection; warm/ moist at surface, dry air in mid levels
*Severe weather hodograph:
veering, strong sfc to 850 directional shear
* >100 J/kg
negative buoyancy is significant
*Good match: BRN < 20 and CAPE >2,000 J/kg
*Strong
cap when > 2 degrees Celsius
*Study depth of
moisture, TT unreasonable when low level moisture is lacking
*KI used for
heavy convective rain, values vary with location/season
*
Instability enhanced by ... daytime heating, outflow boundaries
*Models generally have weak handle on
return flow from Gulf, low level jet, convective rainfall, orography, mesoscale boundaries, and boundary conditions
*
Large hail when freezing level >675 mb, high CAPE, supercell
*Synoptic scale uplift from either surface
WAA or upper level divergence
*Fair weather cumulus: cumulus humulus, cumulus mediocrus
*
T-storm warning when Hail > 3/4", wind > 58 mph, gate to gate shear > 90 knots
*
Sounding types: Inverted V, goal post, Type C, wet microburst

[/COLOR]
 
آخرین ویرایش:

mit6264

New member
دستتون درد نکنه ولی اینا که همش انگلیسیه!!!!!!! پدر ادم در میاد تا بفهمه چی به چیه!!!!:قاطی::تعجب::هنگ:!!!!!
 

rahsazan

کاربر ويژه
دستتون درد نکنه ولی اینا که همش انگلیسیه!!!!!!! پدر ادم در میاد تا بفهمه چی به چیه!!!!:قاطی::تعجب::هنگ:!!!!!

با سلام
:احترام:
مطالب تخصصی در این زمینه به زبان فارسی محدود هست و در صورت وجود، بصورت الکترونیکی موجود نیست به همین دلیل ناچاریم از منابع لاتین استفاده کنیم
 

Amir Mohsen

متخصص بخش هواشناسی
دستتون درد نکنه ولی اینا که همش انگلیسیه!!!!!!! پدر ادم در میاد تا بفهمه چی به چیه!!!!:قاطی::تعجب::هنگ:!!!!!

سلام

زبانش خیلی ساده است .

هر جاش رو که متوجه نمیشید به من بگید تا فارسیش رو بهتون بگم. ولی واقعا این چیزا رو باید به زبون خودش که انگلیسی هست فهمید چون زمانیکه میخواهید نقشه های مورد نظر رو چک کنید دونستن فارسیش کمک زیادی بهتون نمیکنه:سوت:
 

Dr.ben

کاربر ويژه
Total totals Index

TTI < 44: thunderstorms unlikely.
TTI 44 to 45: isolated thunderstorms.
TTI 46 to 47: scattered thunderstorms.
TTI 48 to 49: scattered thunderstorms, isolated severe thunderstorms.
TTI 50 to 51: few thunderstorms, scattered severe thunderstorms, isolated tornadoes.
TTI 52 to 55: few to numerous thunderstorms, scattered to few severe thunderstorms, isolated to scattered tornadoes.
TTI > 56: numerous thunderstorms, few severe thunderstorms, scattered tornadoes.

The definition of the coverage terms is as follows:

Isolated: expect condition to occur in the forecast area but only expect conditions to affect about 10% of the area. (90% of the are won't have the condition).
Widely scattered:10- 20% of the area will be affected by the condition.
Scattered: 20 - 50% of the area will be affected by the condition.
Few or likely: 50 - 70 % of the area will be affected by the condition.
Numerous or just the condition: more than 70 % of the area will be affected by the condition.

TTI is used to forecast thunderstorm coverage and severity. This index is quite good with cold air aloft. It may overcast severe weather when sufficient low-level moisture is not available and with cold upper air. TTI values work best in the flatter lower elevations east of the Rocky Mountains. For operational purposes, TTI correlations need to be adjusted by region in mountainous terrain. Generally speaking the lower TTI values can indicate more severe thunderstorms in the higher terrain region.
Tests on the field (in the States) showed there is a good correlation between severe weather events and TTI values >48.


Formula used: TT = (T850 - T500) + (Td850 - T500) or TT=T850 + Td850 - (2 x T500).

با TT کوچکتر از 44 احتمال همرفت و طوفان تندری بعید به نظر می رسه،
با TT بین 44 تا 45 احتمال طوفان تندری مقطعی وجود داره.
با TT بین 46 تا 47 احتمال طوفان های تندری پراکنده (نامنظم) وجود داره،
با TT بین 48 تا 49 احتمال طوفان تندری پراکنده (نامنظم) و طوفان تندری شدید مقطعی وجود داره،
با TT بین 50 تا 51 احتمال چند طوفان تندری، طوفان تندری شدید پراکنده (نامنظم) و تورنادوهای مقطعی وجود داره.
با TT بین 52 تا 55 احتمال چند طوفان تندری تا طوفان های تندری متعدد، چند طوفان تندری شدید پراکنده (نامنظم) و تورنادوهای مقطعی پراکنده وجود داره.
و با TT بزرگتر از 56 احتمال طوفان های تندری متعدد، چند طوفان تندری شدید و تورنادوهای پراکنده وجود داره.


لینک: http://www.skystef.be/calculator-totaltotalsindex.htm


K Index

KI <20: thunderstorms unlikely.
KI 20 to 25: isolated thunderstorms.
KI 26 to 30: scattered thunderstorms.
KI 31 to 35: few thunderstorms.
KI 36 to 40: few to numerous thunderstorms .
KI > 40: almost 100% risk for thunderstorms.

The K Index is primarily used to forecast heavy rain and thunderstorm potential. It ain't a good predictor for severe vs non severe weather. The K Index was developed for pulse (air mass) thunderstorm forecasting. It works best used in summer period for air mass thunderstorms (no dynamical triggering mechanism).

Tests on the field showed there is a good correlation between no occurrence of thunderstorms and KI values <26.
Formula: K = (T850 -T500) + Td850 - (T700-Td700).

بنابراین
با KI کوچکتر از 20 وقوع طوفان تندری بعید است.
با KI بین 20 تا 25 احتمال وقوع طوفان تندری مقطعی وجود داره.
با KI بین 26 تا 30 احتمال وقوع طوفان های تندری پراکنده وجود داره.
با KI بین 31 تا 35 احتمال وقوع چندین طوفان تندری وجود داره.
با KI بین 36 تا 40 احتمال وقوع چندین طوفان تندری و طوفان های تندری متعدد وجود داره.
با KI بزرگتر از 40 اغلب صد در صد ریسک وقوع طوفان تندری وجود داره.

لینک: http://www.skystef.be/forecast9.html

CAPE

Surface based CAPE (Convective Available Potential Energy) in Joule/kg = zones in color.
Surface based LI (Lifted Index) in deg C = grey lines & values in white boxes.

Both gives an idea about the severity of thunderstorms if they are formed.
Critical values CAPE:

<300 : little or no convective potential.
300 to1000 : weak convective potential.
1000 to 2500: moderate convective potential.
> 2500 : strong convective potential.

Tests on the field shows there is no good correlation between CAPE values and severe weather events. (Weak CAPE and strong wind shear may also produce severe thunderstorms).


Critical values LI (not to be used in winter):

>0 : unlike potential for thunderstorms.
0 to -2 : weak potential, but with trigger (front, trough, orography).
-3 to -5 : moderate potential.
< -5 : strong potential.

Tests on the field shows there is good correlation between LI values < -5 and severe weather events.


بنابراین
با CAPE کوچکتر از 300 پتانسیل وقوع همرفت خیلی کمه یا اصلا وجود نداره.
با CAPE بین 300 تا 1000 پتانسیل وقوع همرفت ضعیفه.
با CAPE بین 1000 تا 2500 پتانسیل وقوع همرفت در سطح متوسط قرار داره.
با CAPE بزرگتر از 2500 پتانسیل وقوع همرفت خیلی قویه.


Surface based Lifted-Index

Tests on the field shows there is no good correlation between CAPE values and severe weather events. (Weak CAPE and strong wind shear may also produce severe thunderstorms).


Critical values LI (not to be used in winter):

>0 : unlike potential for thunderstorms.
0 to -2 : weak potential, but with trigger (front, trough, orography).
-3 to -5 : moderate potential.
< -5 : strong potential.

Tests on the field shows there is good correlation between LI values < -5 and severe weather events.

از Lifted-Index در فصل زمستان استفاده نمی شه.
LI بزرگتر از صفر پتانسیل وقوع طوفان تندری وجود نداره.
با LI بین 0 تا -2 پتانسیل وقوع طوفان تندری ضعیفه.
با LI بین -3 تا -5 پتانسیل وقوع طوفان تندری در سطح متوسط قرار داره.
با LI کوچکتر از -5 پتانسیل وقوع طوفان تندری قویه.

لینک: http://www.skystef.be/forecast9.html


oiap75zsv187to0a11im.jpg


7wlesd589pgfjuiiowb.jpg


لینک: http://www.skystef.be/storm-indices.htm
 
آخرین ویرایش:
بالا