-
توجه: در صورتی که از کاربران قدیمی ایران انجمن هستید و امکان ورود به سایت را ندارید، میتوانید با آیدی altin_admin@ در تلگرام تماس حاصل نمایید.
You are using an out of date browser. It may not display this or other websites correctly.
You should upgrade or use an alternative browser.
You should upgrade or use an alternative browser.
مباحث عمومی هواشناسی تابستان 1393
- شروع کننده موضوع heaven1
- تاریخ شروع
- وضعیت
- موضوع بسته شده است.
Amir Mohsen
متخصص بخش هواشناسی
درود بر هادی عزیز
واقعا خسته نباشید و دست مریزاد
Sent from my SM-N900 using Tapatalk
واقعا خسته نباشید و دست مریزاد
Sent from my SM-N900 using Tapatalk
درود بر هادی عزیز
واقعا خسته نباشید و دست مریزاد
Sent from my SM-N900 using Tapatalk
خواهش میکنم دوست عزیز
یک کم مثل بقیه ایرانی ها حالم گرفتست :ناراحت:
امیدوارم فصلی پر بار از هر لحاظ را در این تایپیک و تایپیک تخصصی مربوطه به همراه دوستان گلم دنبال کنیم:دوست:
seyyedalireza
مدیر موقت
تبریک به ایران و ایرانی
seyyedalireza
مدیر موقت
بچه ها سه روز به کنکور مونده برام دعا کنید
درود بر همه دوستان عزیز
روز اول تیرماه، بلندترین روز سال رو به همه دوستان تبریک عرض میکنم، این روز در ایران قدیم مثل شب یلدا جشن گرفته میشده.
امروز، خورشید به بلندترین محل خودش در آسمان نیمکره شمالی کره زمین قرار میگیره، امروز خورشید در تمام طول مدار راس السرطان عمود و با زاویه 90 درجه تابش خواهد کرد.
نزدیکترین محل این مدار به خاک کشور عزیز ما، جنوب شرق کشور و خلیج گواتر در استان سیستان و بلوچستان هست، این تصویر مربوط به امروز صبح هست که انعکاس نور خورشید روی آب های نیلگون خلیج همیشه پارس و تنگه هرمز کاملا مشخص هست.
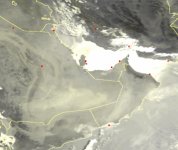
مطالب تکمیلی رو میتونید در این صفحه پیگیری کنید.
http://fa.wikipedia.org/wiki/مدار_رأسالسرطان
روز اول تیرماه، بلندترین روز سال رو به همه دوستان تبریک عرض میکنم، این روز در ایران قدیم مثل شب یلدا جشن گرفته میشده.
امروز، خورشید به بلندترین محل خودش در آسمان نیمکره شمالی کره زمین قرار میگیره، امروز خورشید در تمام طول مدار راس السرطان عمود و با زاویه 90 درجه تابش خواهد کرد.
نزدیکترین محل این مدار به خاک کشور عزیز ما، جنوب شرق کشور و خلیج گواتر در استان سیستان و بلوچستان هست، این تصویر مربوط به امروز صبح هست که انعکاس نور خورشید روی آب های نیلگون خلیج همیشه پارس و تنگه هرمز کاملا مشخص هست.

مطالب تکمیلی رو میتونید در این صفحه پیگیری کنید.
http://fa.wikipedia.org/wiki/مدار_رأسالسرطان
Amir Mohsen
متخصص بخش هواشناسی
سلام بر دوستان عزیز


Amir Mohsen
متخصص بخش هواشناسی
سلام بر دوستان عزیز

درود امیرمحسن عزیز
با این حساب رسما وارد فاز ال نینو شدیم درسته؟
Amir Mohsen
متخصص بخش هواشناسی
درود امیرمحسن عزیز
با این حساب رسما وارد فاز ال نینو شدیم درسته؟
درود آرش عزیز
تقریبا میشه گفت النینو متوسط شروع شده چون از 1+ دما بالاتر رفته
Amir Mohsen
متخصص بخش هواشناسی
The cold upwelling around japan by mid july will seriously dampen the developing nino.
Upwelling cold water anomalies around Japan is what we'd normally see during a +PDO and would actually enhance the prospects of The Child.

تجمع آبهای سرد در دریای ژاپن به معنی مثبت بودن شاخص PDO هست که این میتونه منجر به تولد و رشد کودکی به اسم النینو بشه
Amir Mohsen
متخصص بخش هواشناسی
چرا مدلهای هواشناسی و از جمله مدل مطرح و معتبر CFSv2 آنومالی دمای خنک تر از نرمال رو برای ماه جولای 2014 یعنی گرمترین ماه سال در منطقه ما در نظر گرفته؟


Amir Mohsen
متخصص بخش هواشناسی
نینو 3.4 به عدد 1.060 + رسید.
Sent from my SM-N900 using Tapatalk
Sent from my SM-N900 using Tapatalk
Amir Mohsen
متخصص بخش هواشناسی
Amir Mohsen
متخصص بخش هواشناسی
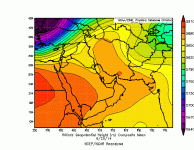
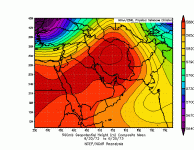
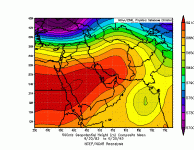
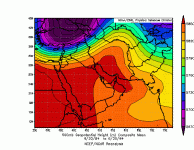
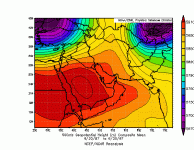
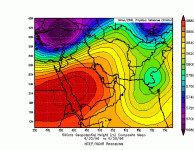
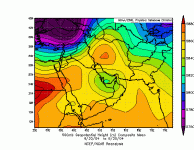
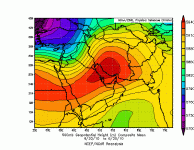
میانگین ارتفاع تراز 500 میلی بار
20 ژوئن 2014
مشاهده پیوست 56720
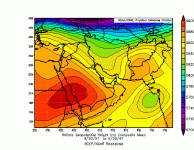
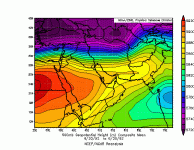
واقعا در سالهای مشابه امسال ( النینو) هیچ سال مشابهی از لحاظ ارتفاع تراز 500 برای روز 20 ژوئن یافت نشد!!!!!!!
Amir Mohsen
متخصص بخش هواشناسی
Waves in the Atmosphere Fueling Extreme Weather
 By Brian Kahn
Follow @blkahn
The pattern of a wavy jet stream was a recurring theme in U.S. weather forecasts this winter as a particularly jagged one essentially split the country in two. While there is a debate over whether climate change causes that pattern, new research shows that the waviness does exacerbate extreme weather.
The research, published in Nature Climate Change on Sunday, looked at planetary waves on a monthly timescale. Waves are essentially the ridges and troughs left as the jet stream, a fast-moving river of air, cuts it way across the middle of the northern hemisphere. The jet stream essentially helps drive weather patterns around the northern half of the globe by pushing around storm systems and sometimes impeding their progress.
 Animation of the jet stream as it moves over North America, illustrating its troughs and ridges.
Credit: NASA
James Screen, a climate scientist at the University of Exeter who co-authored the study, said he wanted to examine how planetary waves influenced persistent weather patterns, such as drought or extreme heat or cold.
He examined the timeframe from 1979-2010, looking for 40 months that exhibited the most extreme precipitation, and for 40 months that showed the most extreme temperature departures from the norm. And the data showed that more wavy waves overwhelmingly accompanied months with temperature or precipitation extremes. Only a small percentage of months with extreme weather corresponded with a more relaxed series of waves.
In the U.S., Screen found that increased waviness made the western part of the country more susceptible to heat waves and the eastern part more likely to experience extreme cold. Droughts in the central part of the country as well in as Europe and central Asia, and wet spells in western Asia were also much more likely when waviness increased.
The regional differences largely stem from geographical features on the ground that influence planetary waves.
“The locations are tied to things like mountain ranges and the temperature contrast between the land and ocean. These are factors that don’t change,” Screen said.
They ensure that while there might be some month-to-month differences, the waves generally follow a similar pattern. And because they’re separated by the jet stream, that helps determine what impacts each region will see.
Kevin Trenberth, a senior scientist at the National Corporation for Atmospheric Research, said the study quantified a fairly well known pattern, though one he said climate scientists often take for granted. Climate researchers have started to look at these waves more closely, from how to use them to predict heat waves to how climate change could alter them.
A commentary in Science last month argued that climate change was at least in part to blame for the pattern that set up over the U.S. this past winter by making waves more common. That commentary is based on research published in 2012 that made the case for why rapid Arctic warming is increasing the odds of wilder planetary waves.
The Arctic is warming twice as fast as areas around the equator because of unique feedbacks involving ice cover in the region. The research argues that as the temperature gradient between the poles and the equator decreases, planetary waves are getting out of whack and becoming even more extreme, though other research has challenged those findings.
Screen’s study, however, only looked at the relationship between waves and extreme events rather than any long-term shift in trends.
“It’s still hotly debated whether we see any change in these waves,” Screen said. “I’m currently sitting in the middle, thinking it’s a plausible hypothesis, but currently the evidence is inconclusive at this point.”
Jennifer Francis, a researcher at Rutgers University who proposed the hypothesis, said there’s a ways to go toward understanding how climate change could affect planetary waves, and the meanderings of the jet stream.
“This is a complicated problem, and finding answers is further challenged by the short time period over which those regional temperature changes have emerged as clear signals from the highly variable atmosphere,” she said in an email. “New approaches to this question are underway, however, and I'm confident that a clearer picture will come to light in the next few years.”
Francis also stressed that understanding waves is just one component of understanding the larger category of extreme weather. Natural fluctuations in ocean temperatures, such as El Niño, and human-caused deforestation and air pollution, can all have an impact. Smaller fluctuations in the atmosphere can also lead to sudden, shorter-scale extreme events.
- Published: June 22nd, 2014
 By Brian Kahn
 Follow @blkahn
The pattern of a wavy jet stream was a recurring theme in U.S. weather forecasts this winter as a particularly jagged one essentially split the country in two. While there is a debate over whether climate change causes that pattern, new research shows that the waviness does exacerbate extreme weather.
The research, published in Nature Climate Change on Sunday, looked at planetary waves on a monthly timescale. Waves are essentially the ridges and troughs left as the jet stream, a fast-moving river of air, cuts it way across the middle of the northern hemisphere. The jet stream essentially helps drive weather patterns around the northern half of the globe by pushing around storm systems and sometimes impeding their progress.

Credit: NASA
James Screen, a climate scientist at the University of Exeter who co-authored the study, said he wanted to examine how planetary waves influenced persistent weather patterns, such as drought or extreme heat or cold.
| RELATED | Hot West, Cold East May be the Norm as World Warms Arctic Warming is Altering Weather Patterns, Study Shows New Method Could Provide Heat Wave Early Warnings |
|---|
In the U.S., Screen found that increased waviness made the western part of the country more susceptible to heat waves and the eastern part more likely to experience extreme cold. Droughts in the central part of the country as well in as Europe and central Asia, and wet spells in western Asia were also much more likely when waviness increased.
The regional differences largely stem from geographical features on the ground that influence planetary waves.
“The locations are tied to things like mountain ranges and the temperature contrast between the land and ocean. These are factors that don’t change,” Screen said.
They ensure that while there might be some month-to-month differences, the waves generally follow a similar pattern. And because they’re separated by the jet stream, that helps determine what impacts each region will see.
Kevin Trenberth, a senior scientist at the National Corporation for Atmospheric Research, said the study quantified a fairly well known pattern, though one he said climate scientists often take for granted. Climate researchers have started to look at these waves more closely, from how to use them to predict heat waves to how climate change could alter them.
A commentary in Science last month argued that climate change was at least in part to blame for the pattern that set up over the U.S. this past winter by making waves more common. That commentary is based on research published in 2012 that made the case for why rapid Arctic warming is increasing the odds of wilder planetary waves.
The Arctic is warming twice as fast as areas around the equator because of unique feedbacks involving ice cover in the region. The research argues that as the temperature gradient between the poles and the equator decreases, planetary waves are getting out of whack and becoming even more extreme, though other research has challenged those findings.
Screen’s study, however, only looked at the relationship between waves and extreme events rather than any long-term shift in trends.
“It’s still hotly debated whether we see any change in these waves,” Screen said. “I’m currently sitting in the middle, thinking it’s a plausible hypothesis, but currently the evidence is inconclusive at this point.”
Jennifer Francis, a researcher at Rutgers University who proposed the hypothesis, said there’s a ways to go toward understanding how climate change could affect planetary waves, and the meanderings of the jet stream.
“This is a complicated problem, and finding answers is further challenged by the short time period over which those regional temperature changes have emerged as clear signals from the highly variable atmosphere,” she said in an email. “New approaches to this question are underway, however, and I'm confident that a clearer picture will come to light in the next few years.”
Francis also stressed that understanding waves is just one component of understanding the larger category of extreme weather. Natural fluctuations in ocean temperatures, such as El Niño, and human-caused deforestation and air pollution, can all have an impact. Smaller fluctuations in the atmosphere can also lead to sudden, shorter-scale extreme events.
Maximum temperature in 24h. 06/22/2014 at 18:00 UTC
(78 of 78 stations)
(78 of 78 stations)
Amir Mohsen
متخصص بخش هواشناسی
Amir Mohsen
متخصص بخش هواشناسی
- وضعیت
- موضوع بسته شده است.


