-
توجه: در صورتی که از کاربران قدیمی ایران انجمن هستید و امکان ورود به سایت را ندارید، میتوانید با آیدی altin_admin@ در تلگرام تماس حاصل نمایید.
You are using an out of date browser. It may not display this or other websites correctly.
You should upgrade or use an alternative browser.
You should upgrade or use an alternative browser.
مباحث عمومی هواشناسی
- شروع کننده موضوع Amir Mohsen
- تاریخ شروع
- وضعیت
- موضوع بسته شده است.
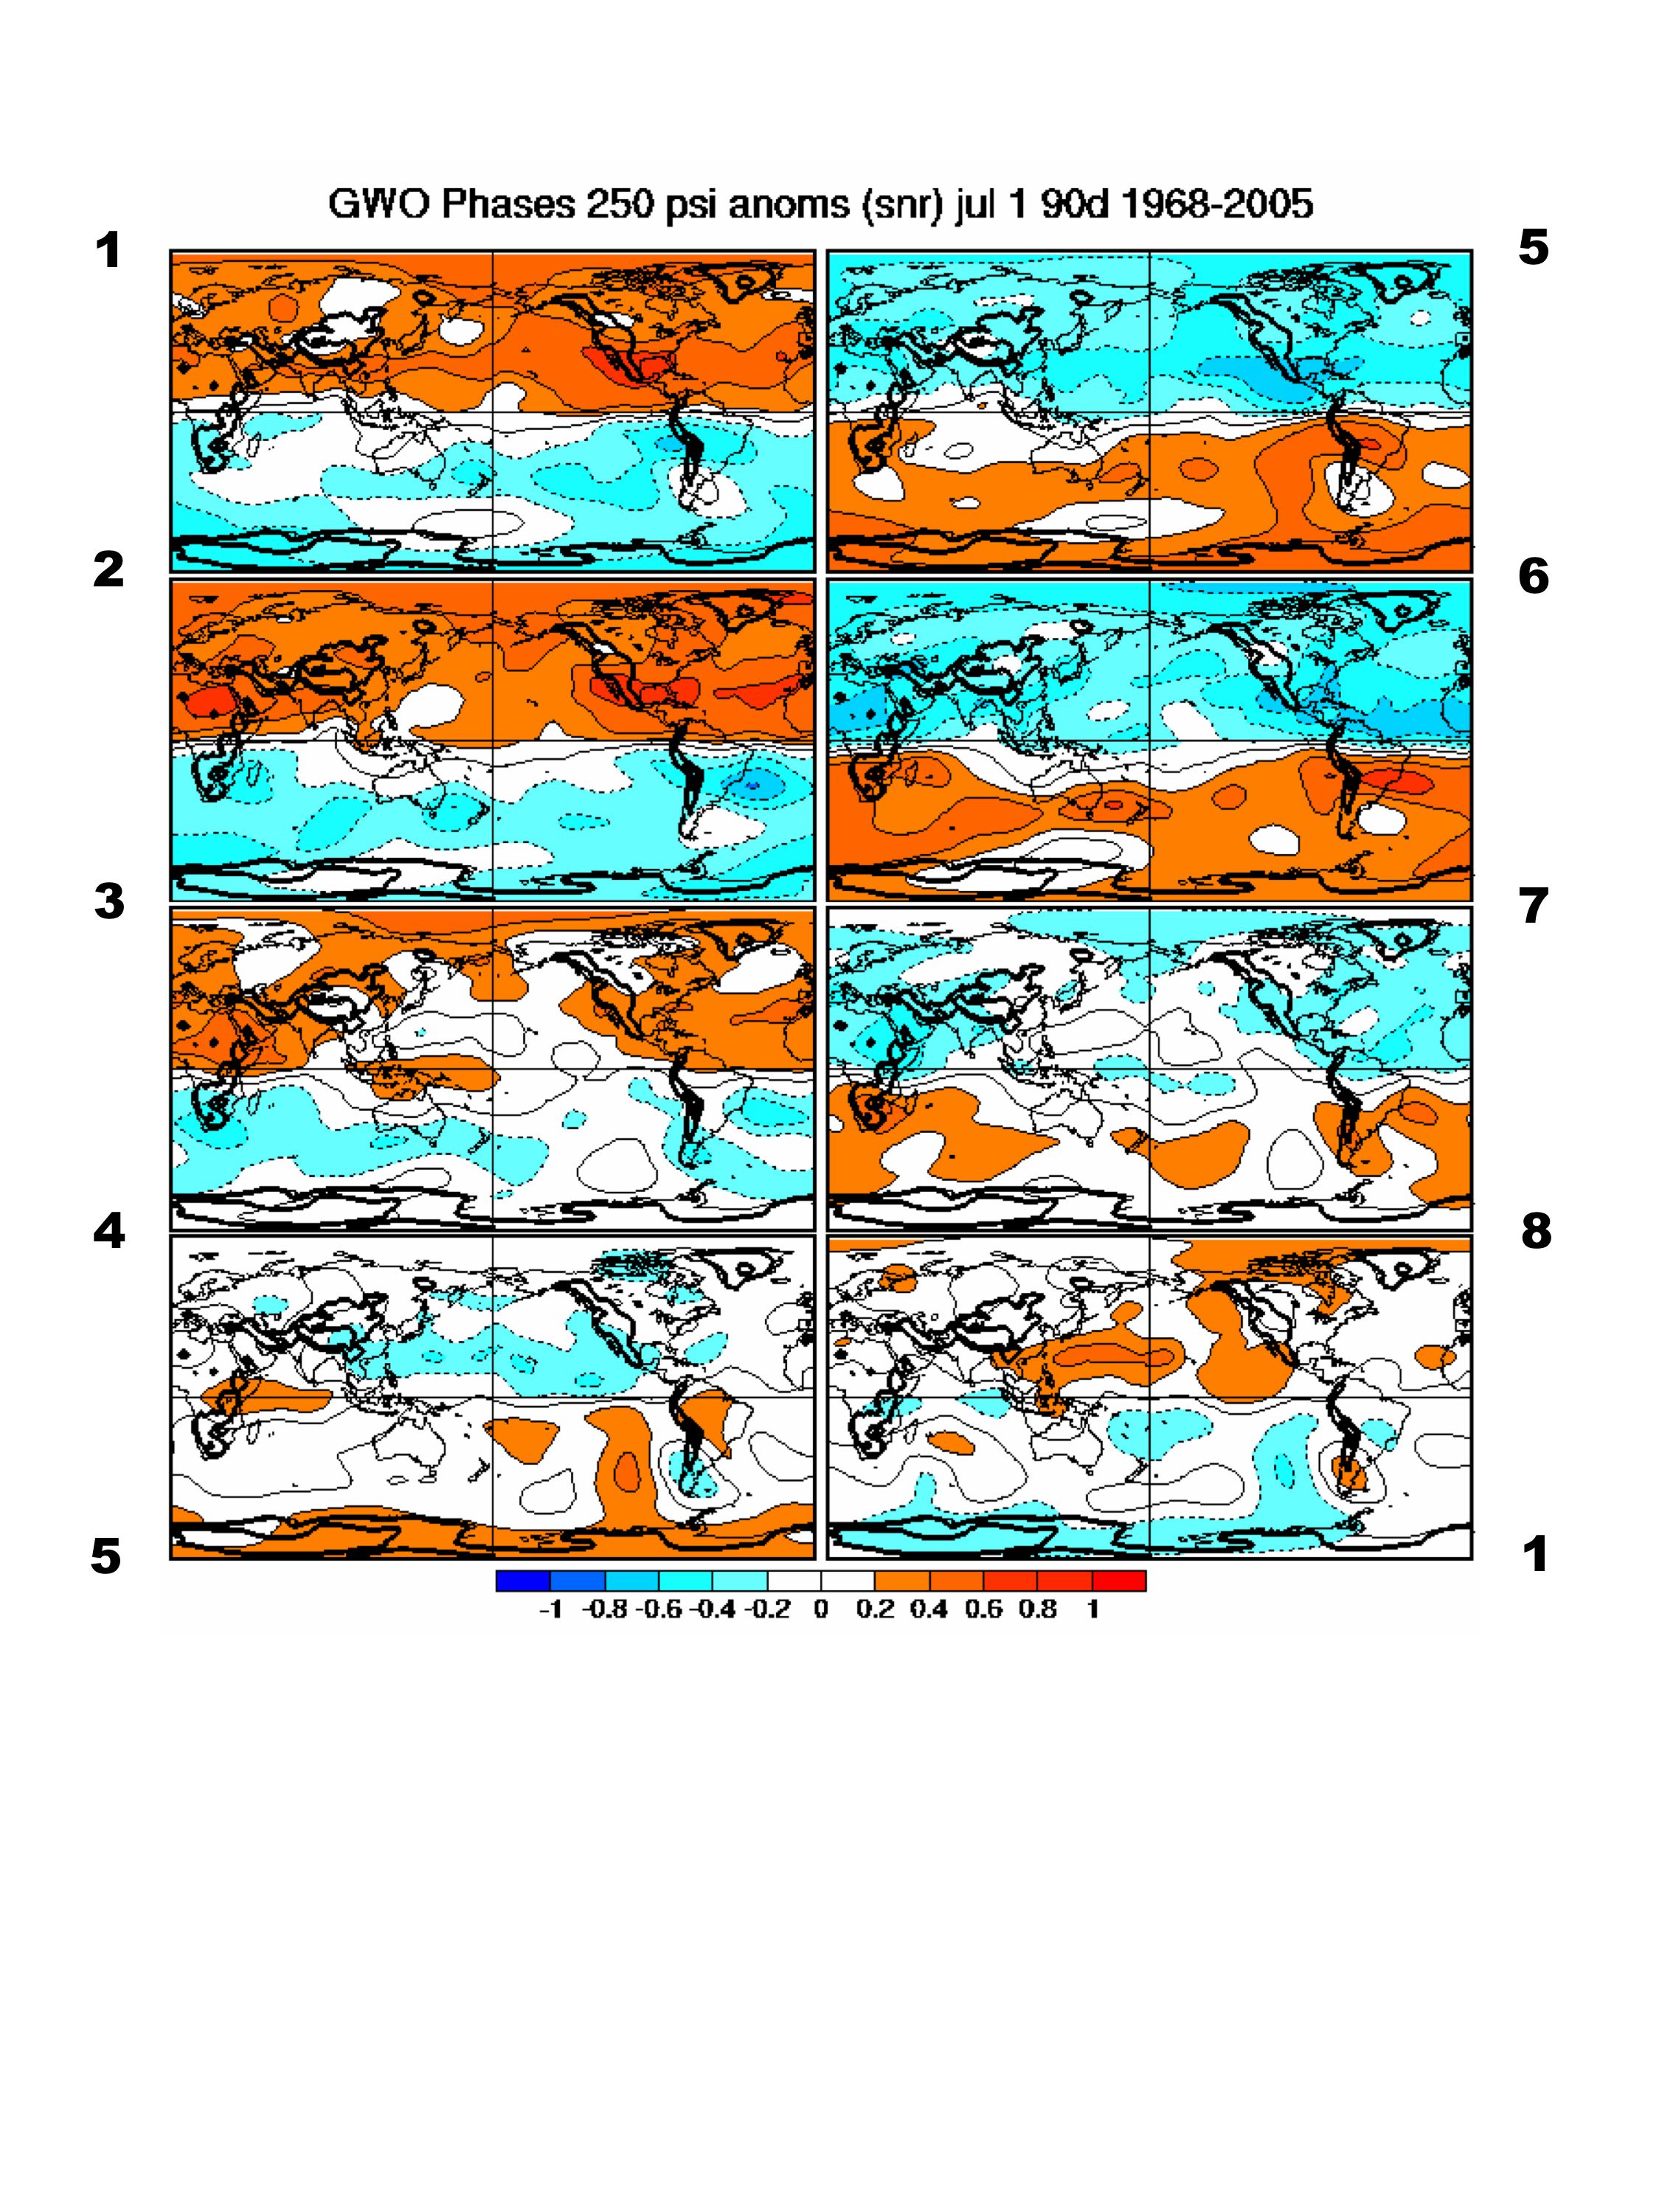
[h=3]Description of CompositesComposites are computed for all eight phases of the GWO and the MJO. A day is included in the composite if the indices have a magnitude of > 1 sigma. Composites will be computed for 91-day periods centered on each day of the year to bring out the seasonal changes in the anomaly structures, presumably a slow process. The GWO indices have been filtered with a 100-day high pass filter to focus on subseasonal events while the MJO indices are also high-pass filtered by subtracting a 120-day moving average, which removes interannual variability. The MJO indices are provided courtesy of Matt Wheeler.
The variables depicted are 0.258 sigma streamfunction from the NCEP/NCAR reanalysis, outgoing longwave radiation from NOAA polar orbiters and 2 meter temperature from the NCEP NARR reanalysis. For convenience, the 0.258 sigma results are referred to as 250 hPa. The data have the seasonal cycle removed and the resulting anomalies are then normalized by their daily standard deviation. The standardized anomalies can be interpreted as the local signal to noise ratios (SNR) for a > one sigma value of the MJO or GWO index. If a Gaussian distribution is assumed, the standardized anomalies also give an estimate of the mean shift in the probability distribution function of the variable. The anomalies or SNRs are generally less than 1 sigma indicating the composite signals are relatively weak.
The phases for the MJO and GWO are now labeled on the composites to help relate the projection in the phase space to a large scale, coherent anomaly pattern. The blue and red shading in the streamfunction composites signify cyclonic and anticyclonic anomalies respectively over the northern hemisphere whereas blue and red over the southern hemisphere signify anticyclonic and cyclonic disturbances, respectively. The other variables have their usual meaning. Negative OLR anomalies siginify deep convection in the tropics and a combination of cloud and temperature effects going poleward.
To estimate the impact of the ENSO cycle on the composite structures, we also constructed a composite for 17 May-14 August for those years with low atmospheric angular momentum anomalies. The composites below for 17 May-14 August can be compared with those on the webpage. La Nina is generally characterized by low AAM and El Nino by high AAM. The years used in the composite were determined by averaging the unfiltered GWO index for the 90 day period over which the composites are to be computed. If the average is > 0.5 sigma and the mean phase is between 2-3, it is designated a low AAM season (~La Nina). For an average phase between 6-7, it is designated a high AAM season (~El Nino). The results so far are only for the GWO and its behavior during La Nina-like, low AAM years.

Amir Mohsen
متخصص بخش هواشناسی
اینهم دامنه نفوذ هوای سرد در این لحظه:


Amir Mohsen
متخصص بخش هواشناسی
سلام محمد رضا جان
می بینم که ایستگاهتون رو رسما افتتاح کردید:گل:
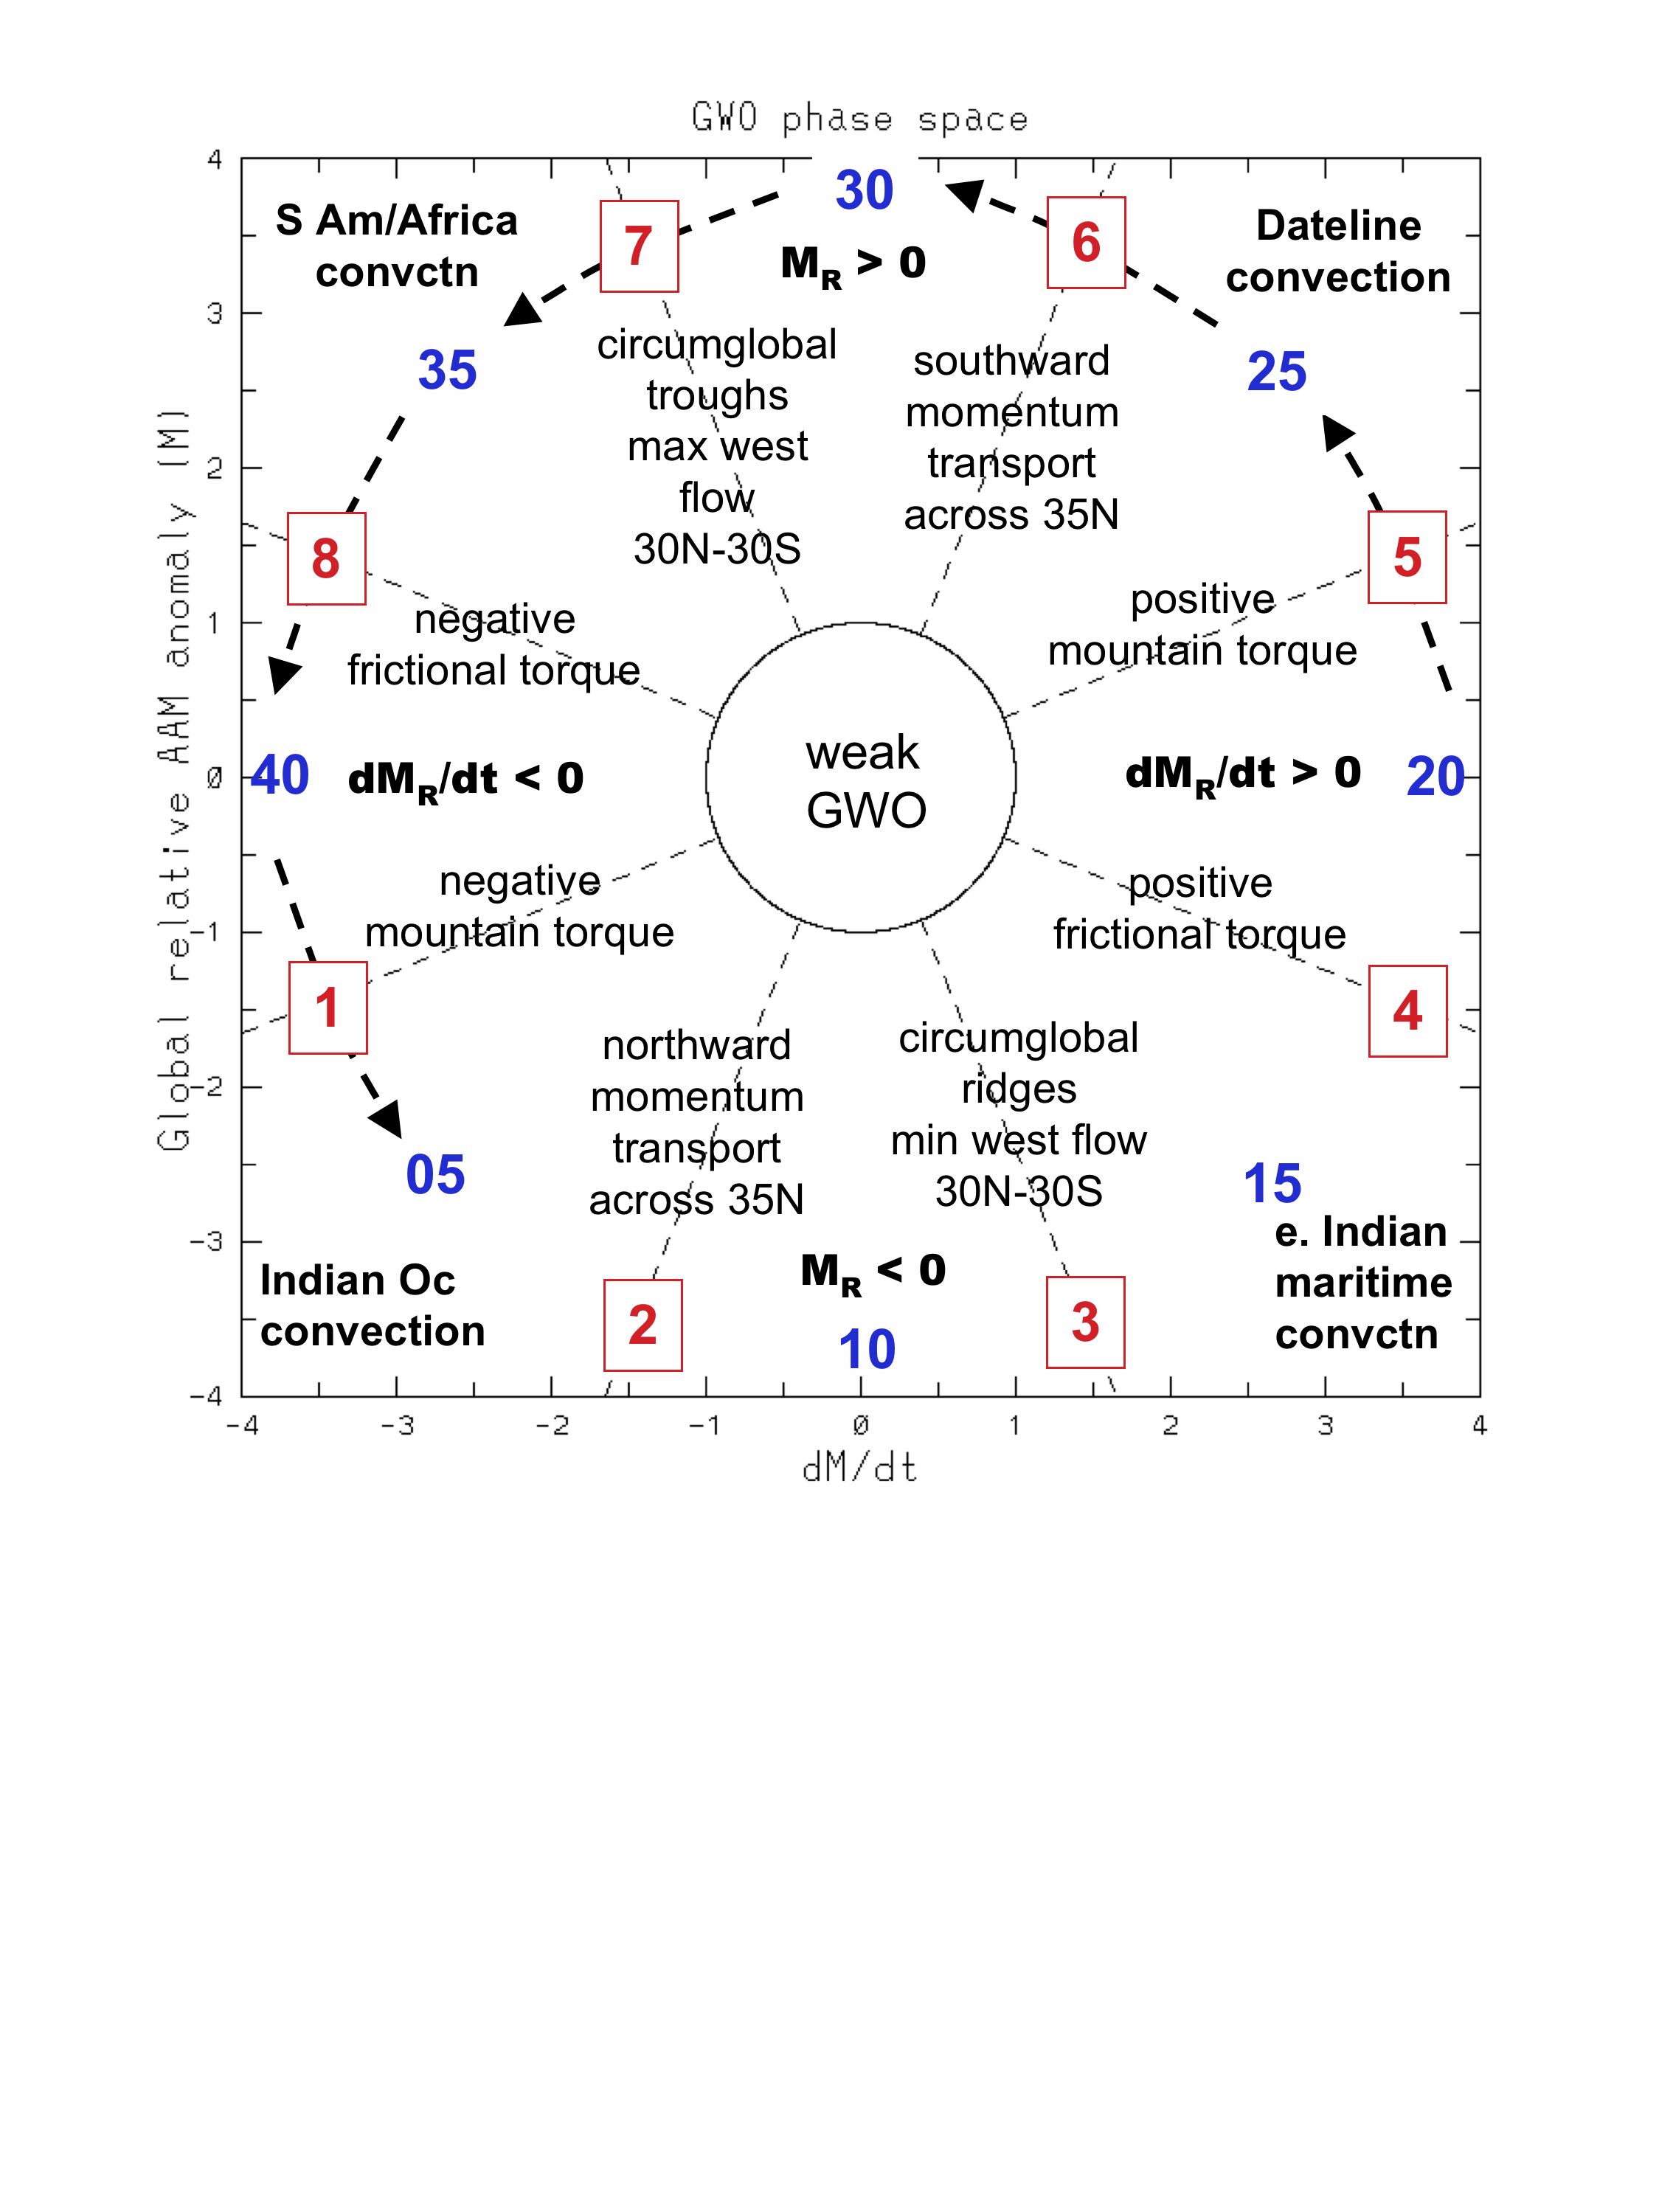
[h=3]Description of GWO phase plotThis quasi-phase space diagram plots standardized anomalies of global relative atmospheric angular momentum (AAM) on the y-axis and global relative AAM time tendency on the x-axis. The anomalies are based on a 1968-96 climatology and are standardized using 5-day average data from 1968-2006. A 5-day running mean is applied to daily data. The 5-day average standard deviation for global AAM is 1.2x10[SUP]25[/SUP] kg m[SUP]2[/SUP] s[SUP]-1[/SUP] and for the global tendency is 1.4x10[SUP]19[/SUP] kg m[SUP]2[/SUP] s[SUP]-2[/SUP]. The global tendency is estimated from the global AAM time series using a 4[SUP]th[/SUP] order (5-point) finite difference scheme. The scheme while highly accurate has problems when 5 points are not available. This and the 5-day running average means there will be changes in the last 4 points plotted when new data are added. The plotting routine was provided courtesy of Matthew Wheeler.
The diagram defines one component of the Global Synoptic Dynamic Model (GSDM) described in Weickmann and Berry (2007; WB07). This so-called global wind oscillation (GWO) is introduced in Weickmann and Berry (submitted; hereafter WB08). Another component of the GSDM is defined by the MJO and there is a link to its phase space plot on the webpage. The relation between the MJO and GWO is also described in WB08.
The GWO phase plot has been rearranged so that comparison with the MJO phase plot will be easier. WB08 describe how this was done. The figure below shows the WB08 phase definition as well as the stages used in WB07. In the future the WB08 phase definition will be used. The current plot orientation has low AAM states at the bottom and high AAM states at the top of the plot. A time evolving anomaly will be seen as a counterclockwise orbit in the GWO phase space. See WB08 for further discussion of the figure (link to pdf above)

سلام بر امیرمحسنمان
سلام محمد رضا جان
می بینم که ایستگاهتون رو رسما افتتاح کردید:گل:
گفتم در اولین سالگرد افتتاح این فروم منم یه اقدامی انجام بدم
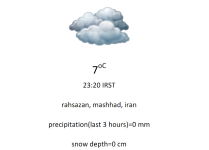
در مورد دما این توضیح رو بدم که با 3 دماسنج دما رو اندازه گرفتم و همین 7 بود!
ali.doosti
کاربر ويژه
سلامسلام
دزفول خیلی سرده شده این چند روزه.
اما مثل اینکه فردا هوا به 4 درجه میرسه طوری که سایت هواشناسی میگه:
http://www.havairan.com/weather/Khuzestan/Dezfūl
اما دیگه نمیدونم درسته یا نه.
متأسفانه رطوبت بالاس از 8 تا 11 فقط 1 درجه کاهش داشتیمو به 4 رسیدیم...بیرونم سوز نداره! صفر برسیم شاهکاره!
Center time of most recent polar pass measurement: 2013 Dec 15 1925 UT
n = 0.88

This plot shows the current extent and position of the auroral oval in the northern hemisphere, extrapolated from measurements taken during the most recent polar pass of the NOAA POES satellite.
The red arrow in the plot, that looks like a clock hand, points toward the noon meridian.
The statistical pattern depicting the auroral oval is appropriate to the auroral activity level determined from the power flux observed during the most recent polar satellite pass. The power fluxes in the statistical pattern are color coded on a scale from 0 to 10 ergs [SUP].[/SUP]cm[SUP]-2.[/SUP]sec[SUP]-1[/SUP] according to the color bar on the right. The pattern has been oriented with respect to the underlying geographic map using the current universal time, updated every ten minutes.
This presentation provides an estimate of the location, extent, and intensity of aurora on a global basis. For example, the presentation gives a guide to the possibility that the aurora is located near a given location in the northern hemisphere under the conditions that existed at the time of the most recent polar satellite pass.
n = 0.88

This plot shows the current extent and position of the auroral oval in the northern hemisphere, extrapolated from measurements taken during the most recent polar pass of the NOAA POES satellite.
The red arrow in the plot, that looks like a clock hand, points toward the noon meridian.
The statistical pattern depicting the auroral oval is appropriate to the auroral activity level determined from the power flux observed during the most recent polar satellite pass. The power fluxes in the statistical pattern are color coded on a scale from 0 to 10 ergs [SUP].[/SUP]cm[SUP]-2.[/SUP]sec[SUP]-1[/SUP] according to the color bar on the right. The pattern has been oriented with respect to the underlying geographic map using the current universal time, updated every ten minutes.
This presentation provides an estimate of the location, extent, and intensity of aurora on a global basis. For example, the presentation gives a guide to the possibility that the aurora is located near a given location in the northern hemisphere under the conditions that existed at the time of the most recent polar satellite pass.
Normalization factor 
A normalization factor of less than 2.0 indicates a reasonable level of confidence in the estimate of power. The more the value of n exceeds 2.0, the less confidence should be placed in the estimate of hemispheric power and the activity level.
The process to estimate the hemispheric power, and the level of auroral activity, involves using this normalization factor which takes into account how effective the satellite was in sampling the aurora during its transit over the polar region. A large (> 2.0) normalization factor indicates that the transit through the aurora was not very effective and the resulting estimate of auroral activity has a lower confidence. In order for users to assess the confidence in a given estimate of auroral power, we now report the numerical value of the normalization factor in our web pages.
Amir Mohsen
متخصص بخش هواشناسی
این دیگه داغ داغه همین حالا از تنور درش آوردم:
آنومالی دمای سطح زمین در ماه نوامبر 2013 در مقایسه با دوره آماری 1998-2006

آنومالی دمای سطح زمین در ماه نوامبر 2013 در مقایسه با دوره آماری 1998-2006

Amir Mohsen
متخصص بخش هواشناسی
نکته اصلی نقشه بالا:
جالبه که از حالا به بعد از همون نقطه ای که آنومالی مثبت داشته قرار هست به دفعات و با همون زاویه ریزش هوای سرد رخ بده
جالبه که از حالا به بعد از همون نقطه ای که آنومالی مثبت داشته قرار هست به دفعات و با همون زاویه ریزش هوای سرد رخ بده
این دیگه داغ داغه همین حالا از تنور درش آوردم:
آنومالی دمای سطح زمین در ماه نوامبر 2013 در مقایسه با دوره آماری 1998-2006

امیر جان از دی خبری ندارین نمیخواین پیش فصلی بدین ............من که منتظر میمونم تا پیش فصلی بدین:خنده1: :شاد2:
Amir Mohsen
متخصص بخش هواشناسی
در واقع وقتی میخواید یک مدل اقلیمی رو در سالیان گذشته با امسال شبیه سازی کنید باید این کار رو برای ماههای قبل از ماه موعود انجام بدید:
مثلا آنومالی دمای ماه نوامبر 2007 اینطوری بوده:

زمستونش شده اون سرمای دهشتناک 2008 و یا 1386 !!!!!!!!!!!
حالا که ما نوامبر 2013 آنومالی دماش اینطور خفن بود پس زمستان 2014 و یا 1392 قرار چه رخداد عجیب و غریبی رخ بده!!!!!!!!!!!!1
در واقع این پاسخی هست که در ماههای آینده قطعا به جوابش خواهید رسید»
آنومالی دمای سطح زمین در نوامبر 2013

مثلا آنومالی دمای ماه نوامبر 2007 اینطوری بوده:

زمستونش شده اون سرمای دهشتناک 2008 و یا 1386 !!!!!!!!!!!
حالا که ما نوامبر 2013 آنومالی دماش اینطور خفن بود پس زمستان 2014 و یا 1392 قرار چه رخداد عجیب و غریبی رخ بده!!!!!!!!!!!!1
در واقع این پاسخی هست که در ماههای آینده قطعا به جوابش خواهید رسید»
آنومالی دمای سطح زمین در نوامبر 2013

Amir Mohsen
متخصص بخش هواشناسی
بارش باران خفیف هم اینک
سمت ما که حدود 2 ساعتی میشد هوا ساکن شده بود ، وزش باد نسبتا شدیدی آغاز شده ولی خبری از بارش نیست و ظاهرا روند کاهش دما اینبار از سمت غرب مشهد داره آغاز میشه!
Amir Mohsen
متخصص بخش هواشناسی
امیر جان از دی خبری ندارین نمیخواین پیش فصلی بدین ............من که منتظر میمونم تا پیش فصلی بدین:خنده1: :شاد2:
مثل سری قبل که فکر نمیکنم فرصتش رو داشته باشم ولی احتمالا مختصر و مفید برای ژانویه میذارم!
منتهی الان که فکرشو میکنم می بینم نقشه ها بارش نشون میدن ولی محقق نمیشه این وسط من باید غر بشنوم وای به حال اینکه پیش بینی بدم بیرون 1 درصد محقق نشه ! خدا میدونه که چه نخواهند کرد بعضی از دوستان!:تعجب2:
مثل سری قبل که فکر نمیکنم فرصتش رو داشته باشم ولی احتمالا مختصر و مفید برای ژانویه میذارم!
منتهی الان که فکرشو میکنم می بینم نقشه ها بارش نشون میدن ولی محقق نمیشه این وسط من باید غر بشنوم وای به حال اینکه پیش بینی بدم بیرون 1 درصد محقق نشه ! خدا میدونه که چه نخواهند کرد بعضی از دوستان!:تعجب2:
بازم خوبه
تی جان قربان برار جان:خنده1:بلامیسر
- وضعیت
- موضوع بسته شده است.


