• توجه: در صورتی که از کاربران قدیمی ایران انجمن هستید و امکان ورود به سایت را ندارید، میتوانید با آیدی altin_admin@ در تلگرام تماس حاصل نمایید.

مباحث عمومی هواشناسی

وضعیت
موضوع بسته شده است.

aghasina21

کاربر ويژه
نمی دونم والله چرا اینجوری میشه. چیز دیگه ای که هست مدت زمان بارش در دو موج اخیر خیلی کم بود. دفعه قبلی که بارش بارون به 24 ساعت هم نرسید. سیستم آخری هم که به برف ختم شد کمتر از 12 ساعت فعالیت بارشی داشت. خدا رو شکر پیش بینی های فعلی برای سیستم پیش رو که از دوشنبه باید فعالیتش آغاز بشه، نشون می ده که حداقل این دفعه چند روزی بارش داریم. دیگه باید ببینیم چی پیش میاد، خدا کنه بارش و سرما تقویت بشن.
ایشالا. ممنون که جواب دادی
 

IRAJ1

کاربر ويژه
ensplume_full.gif
rmm.phase.Last40days.gif
 

Amir Mohsen

متخصص بخش هواشناسی
Frigid Air Grips Big Part of U.S.; Is There A Tropical Link?
  • Published: January 22nd, 2013
75 52 6 0


By Andrew Freedman
Follow @afreedma
The coldest air of the winter season is affecting millions from the northern Plains to New England this week, where temperatures are running well below average, and wind chills are plunging into dangerous territory. The cold weather is likely to stick around for much of the week, and repeated blasts of colder-than-average temperatures are anticipated into February as a possible result of a variety of factors, including a sudden warming event in the upper atmosphere above the Arctic, and a natural cycle of tropical rainfall variability near the Equator.
Infrared satellite image as of Tuesday morning, Jan. 22. The yellow shading in southern Canada and the northern U.S. indicates very cold air.
Click to enlarge the image. Credit: NOAA.
On Tuesday afternoon, the heart of the cold air mass was located over the northern Plains and Upper Midwest, extending eastward into northern New England. In Duluth, for example, the temperature dropped to -21°F on Tuesday morning and temperatures were even lower in northern Minnesota, with International Falls reaching -30°F with a wind chill in the dangerous range between -40 and -50°F.
In Minneapolis, the record streak of days with high temperatures of 0°F or greater came to an end on Monday, when the high temperature was -2°F. The record streak lasted 4 years and 6 days, shattering the previous record by 324 days. Before Jan. 21, 2013, the last time the high temperature at the Minneapolis airport was below zero was on Jan. 15, 2009, when the thermometer climbed to only -6°F, the National Weather Service (NWS) said.
In Milwaukee, the low temperature on Monday was -5°F, which was noteworthy because of the lack of snow cover in that city. Snow cover enhances cooling on clear, cold nights, and reduces daytime temperatures by reflecting incoming sunlight. Therefore, it is often difficult to get such cold temperatures without the assistance of snow cover.
According to the NWS, there have been only 17 instances since 1948 when the low temperature reached or dipped below 0°F with no snow cover on the ground. The most recent occurrence was Jan. 20, 2008, when the low temperature was -6°F.
In Chicago, the temperature at noon on Tuesday was just 4°F, making it one of the coldest days in the Windy City in two years. The low temperature on Monday night was -3°F at Chicago’s Midway Airport.
The colder-than-average conditions are proving to be an especially big shock to many because last winter was extraordinarily mild across much of the U.S. The winter of 2011-12 was the fourth-warmest on record in the lower 48 states, with 27 states recording temperatures that ranked among their top 10 warmest winters. Snow cover was also far below average last year. According to the Rutgers University Global Snow Lab, wintertime snow cover extent in the Lower 48 states was the third smallest in the 46-year satellite record. The only winter seasons that had smaller snow cover extents were the winters of 1991-92 and 1980-81.
In contrast, this winter's snow cover has been above average across the U.S., although there are some areas that have missed out on the action so far.
Chicago, for example, has had just 1.3 inches of snow, which is a paltry 8 percent of its typical seasonal snow total to date, according to the WGN TV Weather Center blog. South Bend, Ind., has had only 9.8 inches of snow, which is a little more than 2 feet below average to date.
The combination of the cold air and strong winds is creating dangerously low wind chill readings in parts of the Great Lakes and in Northern New England, where wind chills are dipping to between -40 and -50°F. Wind chill this low can rapidly lead to frostbite, and the NWS has issued wind chill warnings from Maine to Michigan in response to these conditions. Farther south, in New York City Philadelphia, and Washington, D.C., conditions were generally colder than typical readings at this time of year, but nowhere near as severe.
Map of wind chills, or apparent temperatures, on Tuesday morning, Jan. 22.
Click to enlarge the image. Credit: NOAA.
The turn to colder weather in much of the East may be related to two factors in particular. One is a sudden warming event that took place high in the atmosphere, in a region known as the stratosphere. This sudden stratospheric warming event, which occurred in late December into early January, may be drawing cold air away from the Arctic and into the northern mid-latitudes, while the Arctic enjoys relatively mild temperatures.
While the physics behind sudden stratospheric warming events are complicated, their implications are not: such events are often harbingers of colder weather in North America and Eurasia. The ongoing event favors colder and possibly stormier weather for as long as four to eight weeks after the event, meaning that after a mild start to the winter, the rest of this month and February could bring the coldest weather of the winter season to parts of the U.S., along with a heightened chance of snow.
Sudden stratospheric warming events take place in about half of all Northern Hemisphere winters, and they have been occurring with increasing frequency during the past decade, possibly related to the loss of Arctic sea ice due to global warming. Arctic sea ice declined to its smallest extent on record in September 2012.
In addition to the sudden stratospheric warming event, there may be another natural climate phenomenon at work as well. According to Michelle L'Heureux, a climate scientist at the Climate Prediction Center, which is part of the National Oceanic and Atmospheric Administration (NOAA), a phenomenon known as the Madden-Julian Oscillation, or MJO, also favors colder-than-average conditions in parts of the U.S. right now, and may even be a bigger factor than the more dramatic stratospheric warming event.
L'Heureux has been studying ways to use the status of the MJO to predict large-scale weather patterns beyond a two-week lead time, when forecasts using current techniques tend to diminish.
The MJO is associated with a pattern of tropical rainfall that moves eastward along the equator, going around the world in about 30-to-60 days. Because the MJO influences atmospheric heating through tropical rainfall, it can modify weather patterns far away from the equator.
In a study published in the journal Climate Dynamics in 2012, L’Heureux and her colleagues found that when the MJO is located in a particular phase, as it is now, it can favor more cold air outbreaks over the eastern U.S.
Image showing an area of heavy tropical rains associated with the MJO in the Western Pacific Ocean. (Scientists use outgoing longwave radiation as a proxy for locating areas of persistent, heavy precipitation.)
Click to enlarge the image. Credit: NOAA/CPC via Michelle L'Heteureux.</p>
“The MJO is presently located in a position that favors increased tropical rainfall over the central Pacific (and decreased rainfall over the eastern Indian Ocean-Maritime Continent),” L’Heureux said in an email conversation. “This pattern is most significantly linked to more cold air outbreaks over the eastern U.S.”
L’Heteureux said stratospheric warming events tend to take several weeks to show any impact on North American weather, and that this cold air outbreak may be occurring too soon after the event to be directly attributed to it. She said it’s more likely that the sudden stratospheric warming event will lead to a cold February in parts of the U.S.
“It will be a lot easier to evaluate this cold air outbreak retrospectively, as opposed to doing it on the fly . . . but given how strong the MJO is right now I just cannot imagine it not being the predominant influence,” she said.


آرش-مشهد

کاربر ويژه
سلام دوستان. صبح بخیر.

خدا رو هزاران مرتبه شکر GFS تو آبدیت ساعت 2 شبش بارشامون رو برگردونده::شاد2::فرار::

http://wxweb.meteostar.com/sample/sample_C.shtml?text=oimm&submit.x=5&submit.y=12

خدا کنه آبدیت الانش هم خوب باشه.:گل:

والله من که به بارون خوب هم خیلی خیلی راضیم. خدایا شکرت. همین بارون رو هم از ما نگیر.
 

Amir Mohsen

متخصص بخش هواشناسی
[h=2]What are atmospheric rivers, in more scientific terms?
Examples of AR events (click image for more detail).
ARs are the water-vapor rich part of the broader warm conveyor belt (e.g., Browning, 1990; Carlson, 1991), that is found in extratropical cyclones ("storms"). They result from the action of winds associated with the storm drawing together moisture into a narrow region just ahead of the cold front where low-level winds can sometimes exceed hurricane strength. The term atmospheric river was coined in a seminal scientific paper published in 1998 by researchers Zhu and Newell at MIT (Zhu and Newell 1998). Because they found that most of the water vapor was transported in relatively narrow regions of the atmosphere (90% of the transport occurred typically in 4-5 long, narrow regions roughly 400 km wide), the term atmospheric river was used. A number of formal scientific papers have since been published building on this concept (see the publication list), and forecasters and climate researchers are beginning to apply the ideas and methods to their fields. The satellite images at top-left show strong ARs as seen by satellite. The advent of these specialized satellite observations have revealed ARs over the oceans and have revolutionized understanding of the global importance of ARs (more traditional satellite data available in the past could not clearly detect AR conditions). The interpretation of these satellite images, which represent only water vapor, not winds, was confirmed using NOAA research aircraft data over the Eastern Pacific Ocean and wind profilers along the coast (Ralph et al. 2004). The event shown in the bottom-left image was documented by Ralph et al. (2006), which concluded this AR produced roughly 10 inches of rain in 2 days and caused a flood on the Russian River of northern California. It was also shown that all floods on the Russian River in the 7-year period of study were associated with AR conditions. As of late 2010 there have been a number of papers published on major west coast storms where the presence and importance of AR conditions have been documented. These are provided in an informal list of the "Top Ten ARs" of the last several years on the U.S. West Coast. It is now recognized that the well-known "Pineapple express," storms (a term that has been used on the U.S. West Coast for many years) correspond to a subset of ARs, i.e., those that have a connection to the tropics near Hawaii. In some of the most extreme ARs, the water vapor transport is enhanced by the fact that they entrain (draw in) water vapor directly from the tropics (e.g., Bao et al 2006, Ralph et al. 2011).
[h=2]Can we forecast atmospheric rivers? National Weather Service forecasters located along the west coast are now familiar with the concept of atmospheric rivers and can identify these phenomena in current numerical forecast models. This provides them the capability to give advanced warning of potential heavy rain sometime 5 to 7 days in advance. They have also learned to monitor polar orbiter microwave satellite imagery that provides advanced warning of the presence and movement of these phenomena in the Pacific. During the last two winters, with the development of atmospheric river observatories, forecasters have been able to monitor the strength and location of these rivers as they make landfall and thus improve short-term rainfall forecasts for flash flooding. There are still challenges to predicting rainfall totals in these events as models still struggle with the details of the duration and timing of AR's as they make landfall.
[h=2]Why are ARs capable of producing extreme rainfall on the U.S. West Coast? AR conditions are conducive to creating heavy orographic precipitation (Ralph et al., 2005; MWR) because:

  • they are rich in water vapor,
  • they are associated with strong winds that force the water vapor up mountain sides,
  • the atmospheric conditions do not inhibit upward motions (because the atmospheric static stability is nearly neutral up to about 3 km MSL, on average)
  • once the air moves upward, the water vapor condenses and can form precipitation
[h=2]What is the role of atmospheric rivers in creating floods?
  • Research has shown there were 42 ARs that impacted CA during the winters from 1997 to 2006, and the resulting seven floods that occurred on the Russian River watershed northwest of San Francisco during this period were all associated with AR conditions.
  • A major flood in California, known as the "New years Day Flood" in 1997 cause over $1 Billion in damages and had a well-defined AR.
  • Less formally, ARs are known to result in an order of magnitude larger post-storm stream flow "bumps" (increases) than other California storms, in the Merced and American Rivers.
  • The Pacific Northwest also regularly experiences this type of storm. Case in point is the landfalling AR of early November 2006 that produced heavy rainfall and devastating flooding and debris flows with region-wide damage exceeding $50 million.
  • The Notable AR Events list highlights additional high-impact AR events.
[h=2]How are science and applications of ARs being addressed?
  • Research experiments (CalJet and PacJet) performed by NOAA in the 1998, 2001, and 2002 were conducted to better understand landfalling Pacific winter storms.
  • CalJet/PacJet led to the development of the NOAA Hydrometeorology Testbed (HMT; hmt.noaa.gov). HMT's aim is to accelerate the development and prototyping of advanced hydrometeorological observations, models, and physical process understanding, and to foster infusion of these advances into forecasting operations of the NWS, and to support the broader user community's needs for 21st Century precipitation information.
  • Within HMT, scientists have developed and prototyped an atmospheric river observatory (ARO) designed to further our understanding of the impact of ARs on enhancing precipitation in the coastal mountains and the high Sierra of California.
  • Studies of the potential impacts of climate change on AR characteristics is the focus on an ongoing project – CalWater that is partnering with HMT, the California Energy Commission, Scripps Institution of Oceanography, USGS and others, to explore the potential implications for flood risk and water supply.
  • Under the USGS-led Multihazards project, ARs have become the focus of an emergency preparedness scenario for California that is intended to help the region prepare for a potentially catastrophic series of ARs. The scenario is named "ARkStorm" and has developed an informational video for use with the public (http://urbanearth.gps.caltech.edu/winter-storm/).
[h=2]What are the benefits of studying atmospheric rivers? The community of flood control, water supply and reservoir operators of the West Coast states see ARs as a key phenomenon to understand, monitor and predict as they work to mitigate the risks of major flood events, while maintaining adequate water supply. The frequency and strength of AR events in a given region over the course of a typical west-coast wet season greatly influences the fate of droughts, floods, and many key human endeavors and ecosystems. Better coupling of climate forecasts with seasonal weather forecasts of ARs can improve water management decisions. Long-term monitoring using satellite measurements, offshore aircraft reconnaissance, and land-based atmospheric river observatories, combined with better numerical modeling, scientific progress, and the development of AR-based smart decision aids for resource managers, will enable society to be more resilient to storms and droughts, while protecting our critical ecosystems.


IRAJ1

کاربر ويژه
البته با توجه به حمایت همه جانبه جریانات مرطوب جنوبی بارشها بسیار فراگیرتر از چیزی خواهد بود که نقشه ها نشون میدن ،مثل بارون پاییز اصفهان که فوق العاده بود
 

Amir Mohsen

متخصص بخش هواشناسی
اپدیت جدید نیروی دریایی:

Tau 138 ---- Previous 6-hr Precipitation Rate [mm] and Sea Level Pressure [hPa]
Tau 144 ---- Previous 6-hr Precipitation Rate [mm] and Sea Level Pressure [hPa]
Tau 150 ---- Previous 6-hr Precipitation Rate [mm] and Sea Level Pressure [hPa]
Tau 156 ---- Previous 6-hr Precipitation Rate [mm] and Sea Level Pressure [hPa]
Tau 162 ---- Previous 6-hr Precipitation Rate [mm] and Sea Level Pressure [hPa]
Tau 168 ---- Previous 6-hr Precipitation Rate [mm] and Sea Level Pressure [hPa]
Tau 174 ---- Previous 6-hr Precipitation Rate [mm] and Sea Level Pressure [hPa]
Tau 180 ---- Previous 6-hr Precipitation Rate [mm] and Sea Level Pressure [hPa]
 

Amir Mohsen

متخصص بخش هواشناسی
Tau 114 ---- Tropopause Pressure [mb]
Tau 120 ---- Tropopause Pressure [mb]
Tau 126 ---- Tropopause Pressure [mb]
Tau 132 ---- Tropopause Pressure [mb]
Tau 138 ---- Tropopause Pressure [mb]
Tau 144 ---- Tropopause Pressure [mb]
Tau 150 ---- Tropopause Pressure [mb]
Tau 156 ---- Tropopause Pressure [mb]
Tau 162 ---- Tropopause Pressure [mb]
Tau 168 ---- Tropopause Pressure [mb]
Tau 174 ---- Tropopause Pressure [mb]
Tau 180 ---- Tropopause Pressure [mb]
 

سامیار هواشناس

کاربر ويژه
با سلام به نظر شرایط پیش رو اصلا شرایط رویایی یا طلایی یا.... نیست فکر نمیکنم جبران خشکسالی ماه اخیر دست کم تا اخر بهمن هم اتفاق بیوفته و تا جایی که من میدونیم طبق امار بعد از دیماه خشک بهمن باید جبران میکرد اما انگار نه انگار
 

mohamad_73

کاربر ويژه
اپدیت جدید نیروی دریایی:

Tau 138 ---- Previous 6-hr Precipitation Rate [mm] and Sea Level Pressure [hPa]
Tau 144 ---- Previous 6-hr Precipitation Rate [mm] and Sea Level Pressure [hPa]
Tau 150 ---- Previous 6-hr Precipitation Rate [mm] and Sea Level Pressure [hPa]
Tau 156 ---- Previous 6-hr Precipitation Rate [mm] and Sea Level Pressure [hPa]
Tau 162 ---- Previous 6-hr Precipitation Rate [mm] and Sea Level Pressure [hPa]
Tau 168 ---- Previous 6-hr Precipitation Rate [mm] and Sea Level Pressure [hPa]
Tau 174 ---- Previous 6-hr Precipitation Rate [mm] and Sea Level Pressure [hPa]
Tau 180 ---- Previous 6-hr Precipitation Rate [mm] and Sea Level Pressure [hPa]

سلام امیر محسن جان
من هیچ کدومو نمیتونم ببینم
 

mohamad_73

کاربر ويژه
با سلام به نظر شرایط پیش رو اصلا شرایط رویایی یا طلایی یا.... نیست فکر نمیکنم جبران خشکسالی ماه اخیر دست کم تا اخر بهمن هم اتفاق بیوفته و تا جایی که من میدونیم طبق امار بعد از دیماه خشک بهمن باید جبران میکرد اما انگار نه انگار
سلام
معمولا زمستان گرم باشه بهار سرد پر بارش میشه
به نظرم بهار سرد پر بارشه
 

arashz

مدیر بخش هواشناسی
درود بر همه دوستان، صبح همگی بخیر :گل:

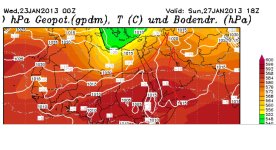
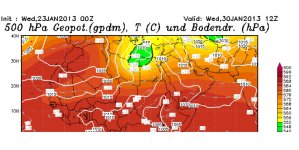
این هم برای دو سیستم پیش رو:

376-1.jpg376-2.jpg
 
وضعیت
موضوع بسته شده است.
بالا