• توجه: در صورتی که از کاربران قدیمی ایران انجمن هستید و امکان ورود به سایت را ندارید، میتوانید با آیدی altin_admin@ در تلگرام تماس حاصل نمایید.

مباحث تخصصی هواشناسی و بررسی تاثیرات شاخصهای دور پیوندی و مولفه های اتمسفری در تابستان و پاییز و زمستان 1393

DR WHO

کاربر ويژه
El Nino and the solar cycle


Posted: February 6, 2010 by Rog Tallbloke in Uncategorized
As you can see from the chart below, El Nino tends to occur away from the peak of the solar cycle. One of the outcomes of this is that the solar cycle’s effect on temperature gets underestimated, because El Nino lifts global temperature at times of low solar activity, and is suppressed at times of high solar activity. La Nina often occurs near the peak of the solar cycle, bringing a couple of cold winters with it. This fact is conveniently disregarded by Dr Leif Svalgaard, who continues to claim the effect of the solar cycle on temperature is only around 0.07C. Rubbish, it’s at least 0.2C, probably more, further amplified by cloud cover change. This means the steady rise in solar activity over most of the C20th was responsible for most of the warming observed, given the over-egging of the global temperature record by Phil Jones at UEA-CRU and James Hansen at NASA-GISS.


.


There is an exception to the rule around 1900 but temperatures were low then anyway. My theory, backed up by calculations I have done on steric sea level rise and the gradient of temperature to the thermocline, is that heat-energy is forced into the ocean as sun spot numbers rise, and is released back out of the ocean on the downslope of the solar cycle and just after minimum. The low run of solar cycles around 1900 allowed the ‘upwelling’ of energy to build up ‘momentum’ and so the heat release continued through the upturn of the low solar cycle. Something similar happened during low solar cycle 20.


The currently high global sea surface temperature is nearly at the same level as 1998, but this is not the whole story. Whereas 1998 was a full blown Pacific Warm Pool event, the current El Nino is a ‘Modoki’ event. This means heat-energy is rising out of the oceans over a broad area of the globe, but the SST’s are not very high in one particular area. This means that much of the heat will escape to space instead of being trapped in by high humidity and then spread around by the trade winds.


This is why temperatures over the continental masses are low, while global lower troposheric temperature is high. Blocking patterns have allowed warm air over the oceans to migrate to the poles, displacing cold air down over the northern hemisphere continents.


The question is, what will happen next? Looking at a similar situation in the past may help. Around 1880, global SST’s peaked in a huge El Nino event, then started to decline, with another big El NINO event 12 years later. Sound familiar? Look how similar the solar cycle phase was then and now.


.


I expect we will see a significant downturn in SST over the coming year. My prediction, for what it’s worth, is that global SST will be 0.1-0.15C below Jan 2008 levels by spring 2011.
 

DR WHO

کاربر ويژه
Renewed signs of an El Nino event in 2014
Date
August 12, 2014 - 4:12PM
21 reading nowRead later

Peter Hannam
Environment Editor, The Sydney Morning Herald
View more articles from Peter Hannam
Follow Peter on Twitter Follow Peter on Google+ Email Peter
Twitter
submit to redditEmail articlePrintReprints & permissions

El Ninos play a big role in the global climate. Photo: NASA
An El Nino remains a possibility in 2014 after renewed signs of the weather event were detected in the Pacific, according to the Bureau of Meteorology.


The normally easterly trade winds have weakened in the past two weeks and temperatures are again picking up in a broad region of the central and eastern equatorial Pacific, the bureau said in its fortnightly update.


If the winds remain weak, “there could be a renewed push to an El Nino”, said Robyn Duell, a senior climatologist at the bureau. “It’s still a real possibility for 2014.”


El Nino years often see above-average temperatures across southern Australia and below-average rainfall across the south and eastern inland parts of the country.


Advertisement
The El Nino-Southern Oscillation phenomenon is watched closely by weather agencies around the world because of the dominant role El Nino and its counterpart, La Nina, play in setting global conditions.


Two weeks ago, the bureau downgraded the prospect of an El Nino this year to about a 50-50 chance, a shift echoed since by the US Climate Prediction Centre although it rates the likelihood as about a 65 per cent possibility.


Weather watching


The Australian bureau, though, says the prospect of an El Nino remains “at least 50 per cent”, with five of the eight major climate models pointing to such an event forming by the spring.


“We are really watching the trade winds over the next fortnight or so, which will be key to telling us what will happen in the spring,” Ms Duell said.


An El Nino would not be welcomed in parts of Australia which are already dry.


Rainfall deficiencies have increased in their extent over south-eastern Queensland and north-eastern NSW, the bureau reported last week.


A region from Bundaberg in Queensland to Coffs Harbour in NSW and inland to Roma and St George has had its driest year since 1901-02, based on area-averaged rainfall.


Southern Australia, though, has not been as dry, with conditions in the Indian Ocean lately favouring above-average rainfall.


A so-called negative Indian Ocean Dipole (IOD) - where waters in the eastern regions of the ocean are relatively warm and those in the west relatively cool – has been a countering influence to the Pacific in recent months, the bureau said.


“It’s hard to know which will be the stronger influence,” Ms Duell said.


Model outlooks, though, indicate the negative-IOD is likely to be relatively short-lived, with more neutral conditions setting in by spring, the bureau said.


The dry and warm conditions in eastern Australia have already seen an early start to the fire season with the NSW Rural Fire Service reporting more than 440 fires in the first week of August, mostly in the northern parts of the state.


Areas around Sydney have also been relatively dry although the 21 millimetres of rain recorded in the 24 hours to 9am Tuesday were the city's best falls in about four months.


Read more: http://www.smh.com.au/environment/w...nt-in-2014-20140812-1037b4.html#ixzz3AANw6Qbw
 

DR WHO

کاربر ويژه
El Nino Signs Re-Emerge as Weakening Trade Winds Warm Pacific
By Phoebe Sedgman Aug 12, 2014 10:46 AM GMT+0430 0 Comments Email Print
Facebook
Twitter
Google+
LinkedIn
Save
The Pacific Ocean has shown renewed signs of a developing El Nino weather pattern, which brings drought to Asia and heavy rains in South America, after trade winds weakened, according to Australia’s weather forecaster.


The chance of the event this year is at least 50 percent, with five of eight climate models suggesting the pattern is likely during the spring, which starts in September, the Bureau of Meteorology said in an update on its website today. If the phenomenon was to occur, it is unlikely to be strong, it said. The bureau maintained a watch for the weather pattern.


El Ninos can roil agricultural markets as farmers contend with drought or too much rain. Palm oil, cocoa, coffee and sugar are among crops most at risk, according to Goldman Sachs Group Inc. The U.S. last week lowered the odds of the pattern developing this year and forecast that the event will be weak.


“Some warming has occurred in the central and eastern equatorial Pacific Ocean in the recent fortnight, due to a weakening of the trade winds,” the Melbourne-based forecaster said. “If the trade winds remain weak, more warming towards El Nino thresholds is possible.”


The odds of the pattern fell to about 65 percent during the Northern Hemisphere fall and early winter, the U.S. Climate Prediction Center said Aug. 7. Last month, the probability was almost 80 percent. The chances of the phenomenon occurring this autumn and winter are lower than earlier projections, the Japan Meteorological Agency said yesterday.


Weak Event


The approximate 30-day Southern Oscillation Index to Aug. 10, which indicates the development and intensity of El Nino or La Nina events, was minus 5.2, according to Australia’s weather bureau. Sustained negative values below minus 8 may indicate an El Nino event, according to the bureau.


The pattern will probably develop as a weak event in late summer or early fall, according to MDA Weather Services. Commodity Weather Group LLC said last month that it may be delayed for several months as Pacific Ocean warming slows.


El Ninos, caused by periodic warmings of the tropical Pacific, occur every two to seven years and are associated with warmer-than-average years. The last El Nino was from 2009 to 2010, and the Pacific has either been in its cooler state, called La Nina, or neutral since then.
 

DR WHO

کاربر ويژه
Climate indicators show renewed signs of El Nino: Australian Bureau of Meteorology
By Reuters | 12 Aug, 2014, 11.18AM ISTPost a Comment
0


inShare
Share More
READ MORE ON » Trade winds | Pacific Ocean | El Nino | Climate indicators | Australian Bureau of Meteorology


The Pacific Ocean has warmed in the last two weeks, the Australian Bureau of Meteorology said.
ET SPECIAL:Save precious time tracking your investments
SYDNEY: The Pacific Ocean has warmed in the last two weeks, the Australian Bureau of Meteorology said on Tuesday, renewing signs of the development of an El Nino weather pattern.


The Pacific Ocean has warmed amid weak trade winds. Should the trend continue, more warming towards an El Nino is possible, the bureau said.


The bureau put the chance of an El Nino at at least 50 per cent.
 

DR WHO

کاربر ويژه
Even now, months after the fact and living in the sunny clutches of summer, the phrase "polar vortex" might send a subzero chill up your spine.


Don't reach for your parka just yet. But AccuWeather, a private weather-forecasting service based in State College, is again talking about the polar vortex, a newly coined phrase to describe the age-old problem of being really cold.


But you might not have to wait until winter. AccuWeather is predicting "short, sporadic" appearances by the polar vortex in September.


"The vortex could slip at times, maybe even briefly in September for the Northeast," said Paul Pastelok , lead long-range forecaster for AccuWeather. "There could be a significant shot of chilly air that comes across the Great Lakes region and into the interior Northeast sometime in mid- to late-September."


Predictions for western portions of the United States are even more dire.


AccuWeather predicts, "The trend for the northern Plains and northeastern Rockies will sway more winterlike, as early snow and cold air blast the area this fall," Pastelok said.


For what it's worth, the Farmer's Almanac, which has been printing forecasts and sharing bits of wisdom since 1818, seems to agree with the general nature of that forecast. The almanac's September forecast for the Great Lakes region calls for record lows on Labor Day, followed by a week of unseasonably cold temperatures.


At the National Weather Service in Cleveland, meteorologist John Mayers used different terms to describe the same thing.


"We had cold winters growing up in Syracuse," he said. "But there was never talk of a polar vortex or anything. It seems like there is a buzzword frenzy going on."


He does agree, however, that a trough -- an area of colder temperatures aloft -- has been lingering over the eastern United States for months and producing lower-than-normal temperatures.


"Whether you want to call it a polar vortex is up to you," Mayers said. "But there is no real indication the pattern is going to break down."


Based on that information, Mayers said it's a reasonable bet that early fall could be colder than usual.


But Mayers said he's not ready to make any predictions about the coming winter.


"It's hard enough to predict the weather three days from now," he said.


The federal government's Climate Prediction Center, which publishes long-range forecasts, is only slightly more certain of its outlook for the region.


The center's three-month forecast for Pennsylvania reports an equal chance of below-average, average, or above-average temperatures.
 

DR WHO

کاربر ويژه
Fall Polar Vortex May Bring Lots Of Rain To East Tenn.
O.J. Early | Updated 17 hours ago


Get ready.


Another polar vortex could strike the U.S. during mid-to-late September, bringing erratic weather to much of the country, AccuWeather projects.


The weather system is expected to bring rainy weather to much of the South, including East Tennessee, the weather service forecasts.


Portions of the Deep South, including Middle and West Tennessee, could see severe weather.


"A lot of times when we were supposedly going into an El Nino, it stopped short of that," said Jessica Winton, a Morristown-based meteorologist. "It looks like we will get above-normal rain, but nothing severe."


El Nino patterns often bring either unseasonably high or low rain totals to the region, according to the National Weather Service in Morristown.


The fall is typically Greene County's driest season of the year.


A polar vortex brought bone-chilling cold to Greene County last winter, when temperatures dipped below zero in February. The 2013-14 winter was one of the coldest and snowiest in recent memory.


Based on AccuWeather projections, here's what most of the U.S. will see should the Polar Vortex strike:


* South: Rainy, wet weather.


* Deep South: Severe storms.


* East Coast: Elevated risk for tropical storms.


* New England: Stormy weather.


* Pacific Northwest: Higher risk for wildfires.


* West Coast: Drought conditions.
 

DR WHO

کاربر ويژه
It’s already August, which means fall is around the corner – and another winter no longer seems that far away. Forecasters are out with some predictions about the weather we can expect in the coming months:


– A polar vortex (if we’re allowed to call it that when it’s not winter) across the Great Lakes and into the interior Northeast during mid-to-late September, says Paul Pastelok, Accuweather’s lead long-range forecaster.


“Temperatures [in the Northeast] will not be as extreme in November when compared to last year, but October could be an extreme month,” he said on Accuweather’s website.


Then plan on a wet November and early winter snow in the northeast, including a couple of big storms in December and early January.


– Early snow and cold in the northern Plains and northern Rockies this fall, according to Accuweather. The cold could expand as far east as the Chicago area.


The National Weather Service, however, is calling for above-average temperatures across the northern Rockies, Plains and Midwest states, including Chicago, over the November-to-January period.


– Above-normal rain from from New Orleans to Atlanta this fall, Accuweather says.


– El Nino will bring moisture to the southwest and Texas in the fall. But no drought relief for California, according to Accuweather. The National Weather Service says expect below-average temperatures in southern Texas in the November-to-January period.


– While Hawaii braces for two hurricanes, the National Oceanic and Atmospheric Administration on Thursday raised the odds of a below-normal hurricane season in the Atlantic and Gulf of Mexico to 70%, from the 50% odds given in May. It says there could be between zero and two major hurricanes, which are category 3 or higher. Hurricane season runs through Nov. 30.


Looking backward, June was the wettest June nationally since 1989, even as 34% of the lower 48 suffered drought conditions, the NOAA said. Worldwide, average land and ocean temperatures in June were the highest since records began in 1880.


– Silvia Ascarelli


Follow Silvia @SilviaAscarelli
 

DR WHO

کاربر ويژه
If you’re not ready to read about early winterlike weather, turn the page.


Click to a different article.


You’ve been warned.


The polar vortex – that extremely cold air that swirls above the North Pole – may make a brief visit to the Northeast next month, AccuWeather.com reported Wednesday.


“There could be a significant shot of chilly air that comes across the Great Lakes region and into the interior Northeast sometime in mid to late September,” said Paul Pastelok, the lead long-range forecaster for the State College, Pa.-based weather forecasting service.


The polar vortex, you may remember, led many local school districts to exceed their annual allotment of snow days last winter because temperatures and the wind chill were considered too dangerously cold for children to be outside. It also was blamed for copious amounts of lake-effect snow.


AccuWeather has even more bad news for fair weather fans: El Niño, the flow of unusually warm surface waters in the equatorial Pacific Ocean that changes rain and temperature patterns, will debut early this winter, fueling early snow across the Northeast.


“December could get kind of wild due to the very active southern jet stream that is going to provide the moisture for bigger snowstorms. The Northeast could have a couple of big storms in December and early January,” Pastelok said.


AccuWeather was the first out of the gate with 2015 winter forecasts. The latest issues of the Old Farmer’s Almanac, which was founded in 1792, and the Farmers’ Almanac, founded in 1818, will be out within a month or so. But a news release from the Old Farmer’s Almanac, which is due out Sept. 9, somewhat echoes AccuWeather’s forecast.


“Another teeth-chatteringly cold winter is on its way!” the release states. “With its traditionally 80 percent-accurate weather forecasts, the Old Farmer’s Almanac predicts that this winter will be another arctic blast with above-normal snowfall throughout much of the nation.”


The folks at the Farmers’ Almanac aren’t saying a word until their Aug. 25 release date.


Meanwhile, the National Weather Service in Buffalo is sticking pretty much with the here and now.


“Here, we only forecast out to seven days,” meteorologist John Rozbicki said Wednesday, declining to comment on the AccuWeather forecast.


Rozbicki said their climate prediction center issues three-month outlooks. The latest, which covers August, September and October, doesn’t suggest any extremes.
 

DR WHO

کاربر ويژه
Is The Boston Weather Affected by El Ni�o, La Ni�a And Sunspots?


El Ni�o and La Ni�a

The name El Ni�o refers to warmer than normal sea temperatures in the central and eastern tropical Pacific ocean west of Peru and Ecuador. It is part of a cycle of changing ocean temperatures known as the El Ni�o/Southern Oscillation, abbreviated ENSO. The cold period of this cycle is know as La Ni�a. The length of the warm El Ni�o phase and the cold La Ni�a may last from 8 months to 2 years. These ENSO has been shown to affect the weather in different parts of the world. But is there any effect in New England? The graphs below help to answer this question.


This graph below shows average annual temperature at Boston during El Ni�o and La Ni�a cycles. El Ni�o related temperatures are plotted in red, La Ni�a temperatures in blue. The temperatures in Fahrenheit indicated on the left side of the graph. The bottom of the graph shows the number of days from the beginning of the start of an El Ni�o or La Ni�a cycle. Negative numbers indicate days before the start of the cycle.


The interpretation is that the Boston temperature over a year averages several tenths of a degree warmer following the start of an El Ni�o compared the start of a La Ni�a cycle. The warmest temperatures averaged over a year, start 120 days (or about 4 months) after the start of the El Ni�o cycle. The coldest is the year following 60 days after the start of a La Ni�a cycle.


Average precipitation at Boston for one year is plotted on the graph below. Precipitation related to the start of El Ni�o is shown in red, La Ni�a in blue. Precipitation amounts in inches are shown along the left side of the graph. Numbers at the bottom of the graph are the number of days from the beginning of an El Ni�o or La Ni�a cycle.


The graph shows that in Boston, the year following the start of El Ni�o averages wetter than that following La Ni�a. The difference is about 8 percent at maximum.


Boston snowfall averages for one year are plotted on the graph below. The numbers on the left side of the graph are the number of inches of snow that fell over a one year interval. La Ni�a data is plotted in blue, El Ni�o in red. Numbers at the bottom are the number of days from the start of the cycle that the year average begins. Negative numbers indicate days before the start of the cycle.


This shows that there is more snow associated with La Ni�a than El Ni�o at Boston. The maximum effects for a year seem to precede the start of the cycle by a few months.


Sunspot Numbers


Sunspots are dark areas of irregular shape on the surface of the Sun. It has been observed that they vary in numbers in both short-term and long-term. An average sunspot cycle lasts 11.1 years. During the cycle the average sunspot count varies from around 15 at minimum to well over 100. Spots are often big enough to be seen with the naked eye. Direct observation of the Sun in a clear sky is painful and dangerous.


The following graphs were made using the 3 years for each sunspot maximum. This consists of one year either side of the year of maximum sunspots. Then averages of temperature, precipitation, and snow fall was computed for these three years and and different offsets from them. For instance for the maximum in 1989 the years 1988, 1989, and 1990 were used. Data plotted on the zero line are annual averages for this span of years for all the sunspot maximums. Data plotted on the -1 line use one year earlier for each of the years while data on the 1 line use one year later for each of the years.

The graph below shows how temperature is related to the sunspot cycle in Boston. The average temperature for one year at Boston is plotted in red. The numbers at the left indicate the temperature in Fahrenheit. The numbers along the bottom of the graph are the number of years from the maximum in the sunspot cycle. The yellow line represents the average sunspot numbers with no coordinate reference.


There appears to be an effect during a sunspot maximum that results in a very slightly cooler yearly average temperature. The temperature then tends to rise again as the sunspot numbers decrease.


Precipitation averages during the sunspot cycle are shown below. Boston yearly precipitation is shown in red with the amount in inches on the left of the graph. The number of years offset from the sunspot maximum is indicated along the bottom of the graph. The yellow line represents the sunspot count number but has no coordinate reference.


Boston annual precipitation decreases slightly when sunspot numbers are high. The difference in average annual precipitation between sunspot maximum and sunspot minimum is about 3 inches.


This graph shows annual snowfall averages at Boston during the sunspot cycle. The numbers on the left side of the graph are snow fall amounts in inches. Numbers along the bottom are the number of years offset from sunspot maximum. The yellow line is an indication of sunspot numbers during one cycle. There are is reference to actual numbers for this on the graph.


The graph clearly shows that the average annual snowfall at Boston rises as sunspot numbers increase. Snowfall is less again as the sunspot minimum approaches.


Warming

Much is said about global warming. You can not draw any conclusions about this using a single location. But, has the temperature in Boston been changing over the years? To examine this average temperatures were computed for 20 year periods every 5 years. The last ten years used only a 10 year average. These are plotted on the graph below centered over the year in the middle of the period.


The trend in average temperature at Boston is clearly up. This is probably partly due to the heat island effect due to energy sources and less vegetation surrounding the city.


These graphs were created using 207 years of climatological data at Boston, dates of El Ni�o and La Ni�a cycles as derived by the Japan Meteorological Agency, and annual sunspot count averages. El Ni�o cycles were from estimated from ocean temperature measurements before satellite data was available. Cycles begin on October 1st and end September 30th. Data used in the graphs was from the period 1872 to 1998.

Data Compiled by Dave Henry
 

DR WHO

کاربر ويژه
The main indicator of El Nino is a continuous trend in which the surface temperature increases over a long period. — Malay Mail pic


PETALING JAYA, Aug 18 — The El Nino phenomenon, which was initially projected to hit Malaysian shores last month month may not arrive anytime soon.


Meteorological Department deputy director-general Alui Bahari said there was still no concrete indication the phenomenon was about to begin.


“In fact, the chance of El Nino occurring within this few months is only 60 per cent,” said Alui.


Alui said for an El Nino occurrence to be confirmed, observations should show a sea surface temperature of above 0.5°C over a period of five months consecutively.


“Right now, the surface temperature is fluctuating and is still below 0.5°C,” he said.


Universiti Malaya Sabah environmental science expert Professor Justin Sentian concurred with Alui, saying there were no signs of El Nino.


“The main indicator of El Nino is a continuous trend in which the surface temperature increases over a long period, usually five months.


“If it goes up and down like it is now, that means El Nino has not occurred,”


he said.


Justin likened the current situation to the episode in 2012 when the scientific community was baffled by El Nino’s no-show, saying it was difficult to predict El Nino.


“Although there are occasional signs that El Nino may occur, it is difficult to pinpoint exactly when it will begin.


“Even we scientists do not actually understand when it will happen,” he said.


“However, we know for sure it will happen, either this year or next year, because El Nino occurs in a cycle.


“When it happens, it will bring a significant change in temperature, especially throughout countries bordering the Equator,” he said.


Earlier this month, the International Research Institute for Climate and Society and National Oceanic and Atmospheric Administration released a statement saying model forecasts had slightly delayed the El Nino onset, with most forecasters expected the phenomenon to begin from August to October and continuing into early 2015.


The last time El Nino occurred was from 2009 to 2010.


Meanwhile, the department’s National Weather Centre has forecast isolated thunderstorms throughout Kuala Lumpur, Putrajaya, Selangor, and a host of other states throughout this week.


51
3 Google +0 0
MORE ON MMOTV
- See more at: What El Nino? It is not even here yet | Malaysia | The Malay Mail Online
 

DR WHO

کاربر ويژه
Asan ang El Niño? What to expect in the coming months
By Karen Berthelsen CardenasAugust 19, 2014 6:27pm


122 7 0 144
In the middle of the sweltering days of May, when temperatures all over the country were peaking, we were bombarded with the news that a “monster El Niño” was in the offing. DOST Secretary Montejo even issued an El Niño Watch on the PAGASA website: “PAGASA is foreseeing the onset of El Niño in June which may peak during the last quarter of 2014 and may last up to the first quarter of 2015.”


As early as April, forecasts were being made that a “monster” or a “mega” El Niño could “be underway in April.” Headlines such as NASA’s “El Niño: Is 2014 the new 1997?” began appearing even as the article itself cautiously said that "it will become much clearer over the next two to three months whether these recent developments are the forerunner of a major El Niño—or any El Niño at all."


However, we have actually remained in ENSO-neutral conditions since April 2012 and although the precursors to an El Niño were being observed in April 2014, as of August we are still officially in an ENSO-neutral period, neither an El Niño nor a La Niña.


What is ENSO-neutral?


The El Niño is part of the global climate phenomenon called the El Niño Southern Oscillation or ENSO, which has an effect on local weather in terms of temperature, rainfall, and cyclone generation.


The El Niño (EN) is the warm phase of ENSO, when the sea-surface temperatures begin to uncharacteristically rise in the central and east-central equatorial Pacific.


The EN brings different weather to different parts of the world, and while we usually think of an EN year as a hot, dry year bringing drought to the Philippines, it may also bring changes in the number, intensity, and tracks of cyclones, largely dependent on the intensity of the episode.


La Niña is the reverse, when the sea surface temperatures in the said areas begin to cool.


An ENSO-neutral phase—what has informally been termed La Nada (The Nothing)—is one when neither El Niño nor La Niña is present and conditions are “normal” or near the long-term average. This usually means a transition to either an El Niño or a La Niña episode.


That’s where we are still.


So what was the scare all about and are we still expecting an El Niño?


Through January and February of 2014, the National Oceanic and Atmospheric Administration’s (NOAA) monthly ENSO diagnostic discussion alert status for El Niño remained Not Active.


It was in March 2014 that the alert status first changed to an El Niño Watch, with conditions still in ENSO-neutral. The discussion also indicated that “ENSO-neutral is expected to continue through the Northern Hemisphere spring 2014, with about a 50% chance of El Niño developing during the summer or fall” and with models showing “considerable uncertainty as to whether El Niño will develop.”


Since that March report, the conditions have remained in ENSO-neutral and the alert status has remained an El Niño Watch. (The alert status is upgraded to El Niño Advisory when EN conditions are observed and expected to continue.)


The following month, the chances of an EN increased exceeding 50% by summer. In May, the chance further increased to 65% during summer. However, it also indicated that uncertainty remained “as to exactly when El Niño will develop and an even greater uncertainty as to how strong it may become.”


It was at this time that forecasts of a strong event circulated from a statement of Dr Wenju Cai, a climate expert at Australia's Commonwealth Scientific and Industrial Research Organization: "I think this event has lots of characteristics with a strong El Nino."


By June the chance of an EN again increased, this time to 70% during the summer and 80% during fall and winter. Models began to “slightly favor” a moderate event although “significant uncertainty” accompanied the prediction, and did not rule out a weaker or stronger event. The probability remained the same in July, but clearly indicating that the chance of a strong El Niño “is not favored” and forecasters anticipated a peak at weak-to-moderate strength.”


The latest NOAA diagnostic discussion released on August 7, indicates a decrease in the chance of El Niño to 65% during fall and winter after recording a decrease in the ONI numbers. El Niño is now expected “to emerge during August-October and to peak at weak strength during the late fall and early winter.”


The latest advisory of 12 August from the Australian Bureau of Meteorology (BOM) that also monitors ENSO is that “the Pacific Ocean has shown some renewed signs of El Niño development” and the chance of an EN developing is “at least 50%, which is double the normal likelihood of an event.”


Does an El Niño develop so late in the year?


The Oceanic Niño Index is a record that the NOAA maintains. It shows the mean sea surface temperature anomalies over three-month overlapping periods in the Niño 3.4 region.


An El Niño event is characterized by a minimum ONI of >= +0.5 C. In order for an official El Niño to be declared, the threshold must be maintained for five overlapping periods.


An EN usually develops from March to June and reaches its peak in December to April, ending in May to July of the following year. But it is not uncommon for it to develop in July to August. But it is quite unusual for an EN to reach its threshold of +0.5 late in the year.


Since 1950, there have only been four EN episodes recorded (out of a total of 17 episodes) to have officially begun in the August-September-October (ASO) three-month overlapping period. These years and the EN intensities were 1976 (weak), 1977 (weak), 1994 (moderate) and 2006 (weak).


No El Niño has ever developed in the Sept-Oct-Nov, Oct-Nov-Dec, nor Nov-Dec-Jan periods, unless you consider the 1958 EN, which reactivated in Oct-Nov-Dec after a brief ENSO-neutral period after a previous strong EN from March 1957 to August 1958.


There have been 17 EN episodes since 1950, if four of these developed in the ASO period that would mean only about 23% develop at this time of the year.


The four episodes that began in ASO, and what sort of typhoons we experienced


Both 1976 and 1977 were years of weak EN episodes that followed an extended strong La Niña from 1973 to 1976 (3 years with a brief neutral period.) In fact, the 1976 and 1977 EN episodes were probably one continuous episode with a brief neutral period separating them.


In November 1976, super typhoon Welpring came close to Northern Luzon but did not make landfall on the mainland. In November of 1977, Typhoon Unding made landfall in Central Luzon. There were no other extremely significant cyclones in the months prior and during the EN episodes in those two years.


If the El Niños of 1976 and 1977 were weak episodes, 1994’s was a moderate one, but that year, 43 systems developed in the Western Pacific.


In October, Typhoon Katring made landfall over Northern Luzon, killing eleven, thousands were evacuated, and much damage was wrought on rice and coconut. Metro Manila was also affected.


In December, Typhoon Garding entered through Samar, affecting the Visayas and Mindanao with 35 dead and over a million homeless.


Another weak episode was experienced in 2006, but this time, from July to December, six super typhoons formed in the Western Pacific, and three of them made landfall over the Philippines: Paeng, Queenie, Reming.


Also in that weak EN year, Milenyo was a category 4 typhoon on the Saffir-Simpson scale, and which also made landfall, affecting the NCR.


Reming and Milenyo are two of the most remembered destructive typhoons to hit the country.


Of course there have been other significant typhoons in El Niño years but, as mentioned, these are those that occurred in years when the EN developed in ASO.


So what happened to El Niño and what’s going to happen now?


When EN news is reported, the focus is generally on sea surface temperatures, because by definition, most understand the ENSO to be a warming or a cooling of the surface of the ocean. But El Niño is actually a coupling event – that means that the ocean and the atmosphere have to interact for development to occur. While the sea surfaces were warming up, it seemed like the atmosphere wasn’t responding as it should have been. Hence, the delay.


El Niño is still forecast to occur late this year, with NOAA giving it a 65% chance (and therefore a 35% chance of not developing). BOM of Australia has given it upwards of 50%.


On the other hand, the Japan Meteorological Agency says that “the possibility of development of El Niño conditions during the northern hemisphere autumn and winter decreased, and is comparable to that of continuation of ENSO neutral conditions.”


Maybe we should look back at March 2014, when, in an article entitled “El Niño or La Nada: The great forecast challenge of 2014,” Bob Henson wrote: “If El Niño doesn’t take shape in the next several months, we may not see it this year at all” and he then went on to quote NCAR scientist Kevin Trenberth: “Once you get toward summer, the odds of getting a major El Niño certainly start to go down.” — TJD, GMA News
 

Amir Mohsen

متخصص بخش هواشناسی
آغاز پدیده اقیانوسی النینو


50.gif

تاریخ : جمعه بیست و هشتم شهریور 1393
51.gif

نویسنده : امیر محسن
52.gif

نظر بدهید


مقدمه: در آغاز بهار امسال دانشمندان و پژوهشگران هواشناسی نسبت به وقوع پدیده النینو قوی مشابه آنچه که در سال 1997 میلادی ( 1376 خورشیدی) رخ داد ، هشدار دادند و اعلام کردند که بدلیل بزرگ مقیاس بودن این پدیده احتمال وقوع تغییرات گسترده جوی در سر تا سر نیمکره شمالی دور از انتظار نخواهد بود!
پدیده النینو همواره با دو متغیر اقیانوسی و اتمسفری همراهی میشود به این معنی که هم باید دمای آب در بخش اکتوریال شرق اقیانوس آرام با گرم شدن همراهی کند و هم اینکه مولفه اتمسفری SOI با قرار گرفتن در فاز منفی تکمیل کننده این پدیده تاثیر گذار بر روند اقلیم دنیا باشد.
بعد از گذر از روزهای ابتدایی ماههای بهار به دلیل قرار گرفتن مولفه اتمسفری( SOI) در فاز مثبت امید ها نسبت به وقوع پدیده النینو مشابه با آن چیزیکه در سال 1376 بوقوع پیوست روز به روز کاهش یافت و سازمانهای بین المللی همانند هواشناسی استرالیا، ژاپن، مرکز ملی اقیانوس شناسی امریکا شانس وقوع این پدیده را در هر آپدیت کاهش دادند تا اینکه مرکز ملی اقیانوس شناسی آمریکا در آخرین بروز رسانی خود در شهریور امسال ، شانس وقوع این پدیده را به 50 تا 65 درصد در اواخر پاییز 2014 و اوایل زمستان 2015 کاهش داد!
برابر با آخرین تحقیقاتی که توسط وب سایت هوای مشهد صورت گرفته( تاثیرات فاز گرم پدیده اقیانوسی انسو" النینو" بر آنومالی بارش و دمای ایران) ،مسلما وقوع فاز گرم انسو ( النینو) منجر به رخ داد تاثیرات مثبت از نقطه نظر بارش در ماههای پاییز - زمستان و بهار در ایران خواهد گردید و فراهم شدن شرایط برای وقوع بارشهای بیشتر از نرمال در ایران ، انتظار بجایی خواهد بود.
آیا ما در پاییز و زمستان پیشرو با پدیده النینو مواجه خواهیم بود؟
شاخص اقیانوسی:
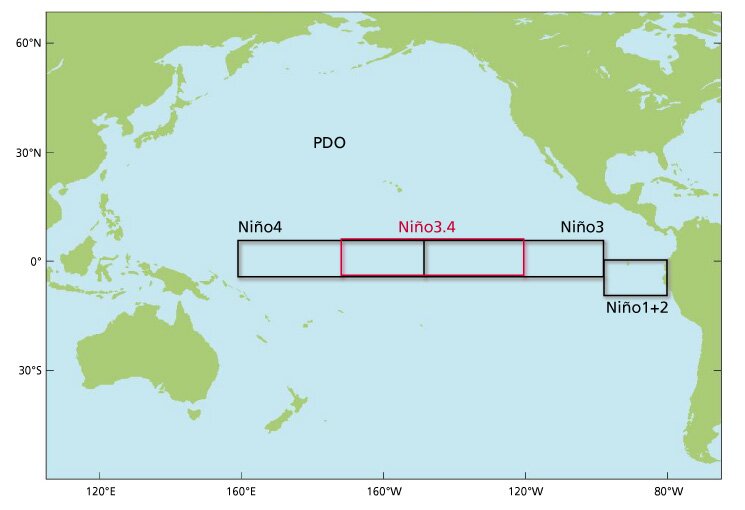
map-pac-EquCylproj.jpg
بر اساس آخرین اطلاعات منتشر شده بعد از سرمایشی که در ماه آگوست در دمای آب در ناحیه Nino 3.4 بوقوع پیوست ، آنومالی دمای آب اقیانوس آرام در این ناحیه به تدریج افزایش پیدا کرد و دمای آب در این بخش به 0.5 + رسید که این وضعیت نشان از همراه شدن شاخص اقیانوسی این پدیده میباشد ( چنانچه آنومالی دمای آب در ناحیه نینو 3.4 به رنج 0.5+ برسد النینو آغاز میشه :
آخرین وضعیت آنومالی دمای آب در ناحیه امتوریال اقیانوس آرام​
l5o8r4d8yp0zgvc164te.gif
شایان ذکر است چنانچه آنومالی دمای آب در ناحیه مذکور به 0.5- کاهش یابد ما شاهد وقوع پدیده لانینا یا فاز سرد اقیانوس ارام خواهیم بود که در فاز سرد این پدیده مشابه با آنچه در زمستان 1386 رخ داد دمای هوا در طول زمستان سردتر از نرمال و مقادیر بارش نیز در میانگین کمتر از نرمال خواهد بود.
و اما وضعیت امروز :
آنچیزیکه ما امروز در بررسی وضعیت آنومالی دمای آب در ناحیه اکتوریال اقیانوس آرام شاهد آن هستیم حکایت از تجمع آب گرم زیر سطحی دارد که با همراهی امواج کلوین در حال حرکت به سمت شرق اقیانوس آرام میباشد که با این ترتیب ضمن به زیر کشیده شدن لایه ترموکلین انتظار بر این است ظرف چند هفته آینده آبهای گرم از اعماق اقیانوس آرام بتدریج به سطح آمده و منجر به گرم شدن دمای آب در ناحیه شرقی اقیانوس آرام گردد:
b0os09nrw0vy787wz2gg.gif
مولفه های اتمسفری:
همانطوریکه در بالا عنوان شد شاخص اقیانوسی انسو دلالت و تمایل بر آغاز النینو دارد و اگه فرض بر این باشد که در حال حاضر در فاز خنثی انسو قرار داشته باشیم ،متغیر های اتمسفری انسو با اطلاعات امروز مشخصا دلالت بر آغاز پدیده النینو دارند!
مولفه نوسان جنوبی South Oscillation Index
مولفه نوسان جنوبی که بصورت خلاصه به آن SOI گفته میشود و بوسیله آن میانگین آنومالی اختلاف فشار سطح دریا بین تاهیتی و داروین در بخش جنوبی اکوتریال اقیانوس ارام اندازه میگیرید میشود، از اواخر ماه جولای 2014 بر روی فاز منفی قفل شده است و فقط 3 بار بصورت جزیی وارد فاز مثبت خفیف شده است.
توضیح اینکه وقوع فاز منفی شاخص SOI معرف وقوع فاز گرم انسو یا النینو خواهد بود و این در حالیست بروز فاز مثبت دلالت بر فاز سرد انسو یا لانینا دارد:

o5b2z3jjfyej9xvwh4t.gif
شاخص چند متغیره انسو Multivariative Enso Index
یکی دیگر از مولفه های کلاسیک اتمسفری که بوسیله آن احتمال وقوع النینو را مورد برسی قرار داده میشود شاخص چند متغیره انسو میباشد که بصورت اختصار به آن MEI گفته میشود.
این شاخص از اواخر ماه MAY تا به امروز در فاز مثبت ( 0.8+ تا 0.9+) قرار داشته است و خوشبختانه به این زودی ها هم هیچ تصوری برای تغییر فاز این شاخص وجود ندارد.
لازم به توضیح میباشد که فاز مثبت این شاخص مقارن با پدیده النینو بوده و فاز منفی آن دلالت بر وقوع پدیده لانینا دارد.
3rj7ijlak5ru6bigt70d.png
چرخه انرژی جنبشی جهانی "Global Atmospheric Angular Momentum "AAM
شاخص جهانی باد Global Wind Osilliation "GWO

چرخه انرژی جنبشی جهانی "AAM " و همچنین شاخص جهانی باد GWO دو متغیر مهم دیگر هستند که شرایط در اتمسفر را برای وقوع پیده النینو فراهم میکنند.
در بازه زمانی که این شاخص در فاز High ( بالا) قرار میگیرد شرایط اتمسفر تمایل زیادی به وقوع پدیده النینو پیدا میکند و این در حالیست که در فاز پایین "LOW" داده های آنالوگ حکایت از فراهم شدن شرایط اتمسفر برای وقوع پدیده لانینا دارند.در طی ماه آگوست 2014 این شاخص همواره در فاز پایین قرار داشت که یکی از دلایل سرمایش دمای آب در بخش اکوتریال اقیانوس آرام هم دقیقا از همین جهت بود.
در حال حاضر افزایش آنومالی دمای آب در بخش اکوتریال اقیانوس آرام مصادف با فاز High شاخص های مذکور گردیده است.
cs3ikb7pt0kb4fw1q8.png
120day average 200 hPa velocity potential anomalies
و در انتهای این مبحث به بررسی آنومالی میانگین پتانسیل ولاسیتی در تراز 200 هکتوپاسکال در 120 روز گذشته میپردازیم . همانطوریکه در پلات ذیل به چشم میخورد محدوده آبی رنگ که مبین فعالیت های طوفان و رعد و برق در محدوده استوایی اقیانوس آرام و واگرایی محض در تراز های بالایی جو میباشد( آنومالی منفی) از اواخر ماه جولای 2014 بتدریج در حال جابجایی از سمت حوزه غربی اقیانوس آرام به سمت حوزه شرقی این اقیانوس میباشد که این موضوع یکی از شواهد مهم وقوع فاز گرم انسو یا همان پدیده النینو میباشد.

fr5h70b4heu6lddyz5ri.png
نتیجه گیری:
ما در حال حاضر در دوره گذار از فاز سرد اقیانوس آرام و ورود به فاز گرم بخش شرقی اکتوریال اقیانوس ارام میباشیم. بررسی تمام فاکتورهای اتمسفری در حال حاضر دلالت قوی بر بروز پدیده النینو در ظرف یک الی دو ماه آینده دارند که احتمال تقویت تمام فاکتور اقیانوسی و اتمسفری همراهی کننده پدیده النینو و تشدید این پدیده دور از انتظار نمیباشد.
جمعه 28 شهریور ماه 1393
امیر محسن ظهوریان


بالا