• توجه: در صورتی که از کاربران قدیمی ایران انجمن هستید و امکان ورود به سایت را ندارید، میتوانید با آیدی altin_admin@ در تلگرام تماس حاصل نمایید.

مباحث عمومی هواشناسی تابستان 1393

وضعیت
موضوع بسته شده است.

DR WHO

کاربر ويژه
More expecting mothers are getting ready for special deliveries this fall. It's being called the Polar Vortex baby boom.


View video


Maternity wards are busier than ever some nine months after the end of our bitter cold winter.


Meet Olivia Doyel who came into the world Thursday.


"When we got here only one room was available so the whole place was full, so it's busy," said Brandon Doyel, a new father.


All 39 maternity rooms and the NICU are full right now at Unity Point Health in Des Moines.


Doctors believe the baby bonanza is a result of the polar vortex last December and January. It was one of the snowiest and coldest winters on record.


"We tried to avoid the snow and went to the Bahamas and that's when she happened," said Doyel.


Even the Doyel's doctor is due any day and the hospital spokeswoman started having contractions during our interviews on Friday.


"I don't know if there's any science about it. In Iowa, there's not a lot to do than to try to keep warm," said Amy Varcoe, Unity Point spokeswoman.


"I always made the assumption it's winter nights and cozy nights, a little bit of cabin fever," said Dr. Amy Bingaman.


Bingaman is feeling the whiplash of winter in the delivery room now.


"Seven deliveries in nine hours so it can be very busy," said Bingaman.


The increase in births in Iowa is part of a nationwide trend with August and September being the busiest months in maternity wards.


"With all the cold last winter, people are trying to find a way to stay warm inside. What else you going to do?" said KCCI Meteorologist Metinka Slater.


With meteorologists forecasting another frigid winter ahead, those hoping to get pregnant may want to plan ahead to avoid a crowd of blizzard babies next fall.


"Get busy now then you'll have plenty of room and space come spring and summer," said Varcoe.
 

rahsazan

کاربر ويژه
میلاد امام مهربانی، حضرت رضا(ع) مبــــــــــــــــــــــا رک

سلام بر دوستان

58496138394574076793.jpg
 

seyyedalireza

مدیر موقت
:شاد2::گل:ولادت امام رضا بر همه ی مشهدی ها وخراسانی ها و ایرانی ها ومسلمانان و همه ی جهانیان مبارک باد:گل::شاد2:
 

DR WHO

کاربر ويژه
Cheyenne, WY - It's September and the end of summer is near. The summer of 2014 was a rather cool and wet one, which makes one wonder if it will carry over in to the winter months.


There are a few things that could affect the outcome of the 2014 - 2015 winter, the El Niño Southern Oscillation (ENSO) being one of them and the Polar Vortex being another.


Earlier this year, the National Oceanic and Atmospheric Administration (NOAA) gave an 80% chance that an El Niño would develop between September and October. Early in September, NOAA dropped the probability to 65%, expressing a bit of uncertainty in an El Niño developing within the next month or two.


Despite the uncertainty, a weak El Niño is still expected to develop by October due to the fact that Sea Surface Temperatures (SST) in the Niño 3.4 region (Figures 1 & 2) have warmed from 0.0°C to 0.4°C in the last 3 weeks. In addition to the trend of warming temperatures in the Pacific, model projections also suggest a weak El Niño developing by October (Figure 3). An El Niño is defined by SSTs in the 3.4 Region climbing to 0.5°C for a period of 1 month.


Depending on it's strength, an El Niño could benefit drought stricken regions of California and perhaps parts of Texas by bringing in a constant stream of subtropical moisture. However, if the current projections of a weak El Niño developing hold true, then the benefits will likely remain marginal for the state of California.


As for SE Wyoming, we would typically see near average to above average temperatures and near average precipitation. However, there are other factors that could affect our winter and keep it anything but 'typical'. One of these factors is the now infamous Polar Vortex and the corresponding Arctic Oscillation.


Thanks to the national media, the term 'Polar Vortex' was used, incorrectly, to describe a strong Arctic outbreak that plagued much of the country in early 2014. While the Polar Vortex does exist and has always existed, it's important to understand what it is.


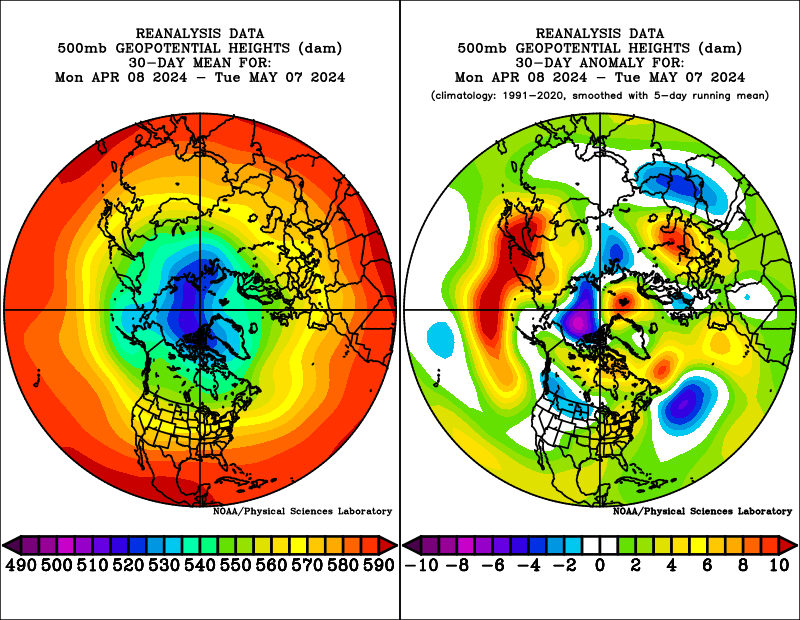
The Polar Vortex is a large scale wind pattern in the middle and upper troposphere where winds rotate cyclonically around the Earth's poles (Figure 4). While the Polar Vortex will strengthen and weaken at times, it never moves from the poles.


Many folks in the media associated the Arctic outbreaks of early 2014 with a STRONG Polar Vortex. This statement is also incorrect. In fact, the arctic air that swept across the country was in response to WEAK Polar Vortex.


You can think of the Polar Vortex as a spinning top that never stops spinning. When the top is spinning fast, it will move in a circular motion nearly vertical in a tight spin. If you were to interfere with the top by briefly placing a finger on it, the spin of the top would become loose and the top would wobble uncontrollably. The spin of the Polar Vortex acts in a similar way.


When the Polar Vortex is strong, the circulation around the North Pole is faster keeping the arctic air trapped near the Arctic Circle. When the Polar Vortex weakens, the circulation around the North Pole becomes much weaker and more disorganized. This allows the cold air to escape from the North Pole and move towards the lower Latitudes of the Northern Hemisphere.


While it is not completely understood why or how the Polar Vortex weakens, there are theories that a warmer Stratosphere due to less Sea Ice and Solar Cycles could lead to warmer temperatures and weaker jet stream winds in the Earth's polar regions.


Another cycle worth looking at is the Arctic Oscillation, which is often related to the strength of the Polar Vortex. The Polar Vortex is a Stratospheric phenomenon while the Arctic Oscillation is more of a cycle that occurs on the Earth's surface.


The Arctic Oscillation (AO) has two phases, a positive phase where arctic air is kept near the North Pole and a negative phase where temperatures are warmer near the poles and colder temperatures are experienced at middle latitudes. Often a weak Polar Vortex would coincide with a negative phase AO and a strong Polar Vortex would be connected to a positive AO. Interestingly enough, the AO was in a positive phase despite a weak Polar Vortex and frigid temperatures across much of the United States. That's because the polar vortex was not weaker across the entire Northern Hemisphere, just over North America and Eastern Siberia.


A good example of a negative phase AO would be the winter of 2009-2010. That winter, much of the Northern Hemisphere experienced colder than average temperatures. This also coincided with a Moderate El Niño. That winter, Cheyenne saw it's second snowiest season on record with 104.8 inches of snow. This leads in to my forecast for the 2014-2015 Winter.


The Forecast


The AO has been generally negative throughout the summer of 2014 (Figure 5) which explains the cool weather we have experienced this year. It seems that this trend could carry over in to the winter of 2014-2015 bringing much of the US Cooler than normal temperatures. With a weak El Niño expected this winter, we could be looking at a similar set up to that of 2009-2010.


Here is what I think the Tri-State Region will see this winter:


At this point, I would anticipate near to below average temperatures with a few Arctic outbreaks from late December through February. Thanks to a weak El Niño coinciding with a negative phase AO, I would also expect to see above average snowfall through early spring. The mountains of SE Wyoming and Colorado should do well this winter with above average snowfall. Meanwhile, the mountains in NW Wyoming will likely see below average snowfall and slightly above average temperatures.
 

Amir Mohsen

متخصص بخش هواشناسی
سلام و صبح بخیر دوستان عزیز


clip_image002_thumb.jpg


Thursday, September 04, 2014
Global Temperature Update - No global warming for 17 years 11 months ...or 19 years, according to a key statistical paper.
By Christopher Monckton of Brenchley |
The Great Pause has now persisted for 17 years 11 months. Indeed, to three decimal places on a per-decade basis, there has been no global warming for 18 full years. Professor Ross McKitrick, however, has upped the ante with a new statistical paper to say there has been no global warming for 19 years.
Whichever value one adopts, it is becoming harder and harder to maintain that we face a “climate crisis” caused by our past and present sins of emission.
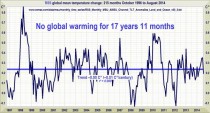
Taking the least-squares linear-regression trend on Remote Sensing Systems’ satellite-based monthly global mean lower-troposphere temperature dataset, there has been no global warming - none at all - for at least 215 months.
This is the longest continuous period without any warming in the global instrumental temperature record since the satellites first watched in 1979. It has endured for half the satellite temperature record. Yet the Great Pause coincides with a continuing, rapid increase in atmospheric CO2 concentration.
clip_image002_thumb_thumb.jpg

Figure 1. Enlarged. The monthly global mean lower-troposphere temperature anomalies (dark blue) and trend (thick bright blue line), October 1996 to August 2014, showing no trend for 17 years 11 months.
The hiatus period of 17 years 11 months, or 215 months, is the farthest back one can go in the RSS satellite temperature record and still show a sub-zero trend.
Yet the length of the Great Pause in global warming, significant though it now is, is of less importance than the ever-growing discrepancy between the temperature trends predicted by models and the far less exciting real-world temperature change that has been observed.
The First Assessment Report predicted that global temperature would rise by 1.0 [0.7, 1.5] C to 2025, equivalent to 2.8 [1.9, 4.2] C per century. The executive summary asked, “How much confidence do we have in our predictions” IPCC pointed out some uncertainties (clouds, oceans, etc.), but concluded:
“Nevertheless, ...we have substantial confidence that models can predict at least the broad-scale features of climate change… There are similarities between results from the coupled models using simple representations of the ocean and those using more sophisticated descriptions, and our understanding of such differences as do occur gives us some confidence in the results.”
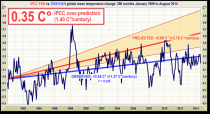
That “substantial confidence” was substantial over-confidence. A quarter-century after 1990, the outturn to date expressed as the least-squares linear-regression trend on the mean of the RSS and UAH monthly global mean surface temperature anomalies is 0.34 C, equivalent to just 1.4 C/century, or exactly half of the central estimate in IPCC (1990) and well below even the least estimate (Fig. 2).
clip_image004_thumb_thumb.png

Figure 2. Enlarged.
Near-term projections of warming at a rate equivalent to 2.8 [1.9, 4.2] K/century , made with “substantial confidence” in IPCC (1990), January 1990 to August 2014 (orange region and red trend line), vs. observed anomalies (dark blue) and trend (bright blue) at less than 1.4 K/century equivalent, taken as the mean of the RSS and UAH satellite monthly mean lower-troposphere temperature anomalies.
The Great Pause is a growing embarrassment to those who had told us with “substantial confidence” that the science was settled and the debate over. Nature had other ideas. Though more than two dozen more or less implausible excuses for the Pause are appearing in nervous reviewed journals, the possibility that the Pause is occurring because the computer models are simply wrong about the sensitivity of temperature to manmade greenhouse gases can no longer be dismissed.
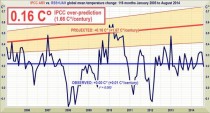
Remarkably, even the IPCC’s latest and much reduced near-term global-warming projections are also excessive (Fig. 3).
clip_image006_thumb_thumb.jpg

Figure 3. Enlarged.
Predicted temperature change, January 2005 to August 2014, at a rate equivalent to 1.7 [1.0, 2.3] C/century (orange zone with thick red best-estimate trend line), compared with the observed anomalies (dark blue) and zero real-world trend (bright blue), taken as the average of the RSS and UAH satellite lower-troposphere temperature anomalies.
In 1990, the IPCC’s central estimate of near-term warming was higher by two-thirds than it is today. Then it was 2.8 C/century equivalent. Now it is just 1.7 C equivalent and, as Fig. 3 shows, even that is proving to be a substantial exaggeration.
On the RSS satellite data, there has been no global warming statistically distinguishable from zero for more than 26 years. None of the models predicted that, in effect, there would be no global warming for a quarter of a century.
The Great Pause may well come to an end by this winter. An El Nino event is underway and would normally peak during the northern-hemisphere winter. There is too little information to say how much temporary warming it will cause, but a new wave of warm water has emerged in recent days, so one should not yet write off this El Nino as a non-event. The temperature spikes caused by the El Ninos of 1998, 2007, and 2010 are clearly visible in Figs. 1-3.
El Ninos occur about every three or four years, though no one is entirely sure what triggers them. They cause a temporary spike in temperature, often followed by a sharp drop during the la Nina phase, as can be seen in 1999, 2008, and 2011-2012, where there was a “double-dip” La Nina that is one of the excuses for the Pause.
The ratio of El Ninos to La Ninas tends to fall during the 30-year negative or cooling phases of the Pacific Decadal Oscillation, the latest of which began in late 2001. So, though the Pause may pause or even shorten for a few months at the turn of the year, it may well resume late in 2015 . Either way, it is ever clearer that global warming has not been happening at anything like the rate predicted by the climate models, and is not at all likely to occur even at the much-reduced rate now predicted. There could be as little as 1C global warming this century, not the 3-4 C predicted by the IPCC.
Key facts about global temperature
The RSS satellite dataset shows no global warming at all for 215 months from October 1996 to August 2014. That is more than half the 428-month satellite record.
The fastest measured centennial warming rate was in Central England from 1663-1762, at 0.9 C/century before the industrial revolution. It was not our fault.
The global warming trend since 1900 is equivalent to 0.8 C per century. This is well within natural variability and may not have much to do with us.
The fastest measured warming trend lasting ten years or more occurred over the 40 years from 1694-1733 in Central England. It was equivalent to 4.3 C per century.
Since 1950, when a human influence on global temperature first became theoretically possible, the global warming trend has been equivalent to below 1.2 C per century.
The fastest warming rate lasting ten years or more since 1950 occurred over the 33 years from 1974 to 2006. It was equivalent to 2.0 C per century.
In 1990, the IPCC’s mid-range prediction of near-term warming was equivalent to 2.8 C per century, higher by two-thirds than its current prediction of 1.7 /century.
The global warming trend since 1990, when the IPCC wrote its first report, is equivalent to below 1.4 C per century half of what the IPCC had then predicted. Though the IPCC has cut its near-term warming prediction, it has not cut its high-end business as usual centennial warming prediction of 4.8 C warming to 2100. The IPCC;s predicted 4.8 C warming by 2100 is well over twice the greatest rate of warming lasting more than ten years that has been measured since 1950.
The IPCC’s 4.8 C by 2100 prediction is almost four times the observed real-world warming trend since we might in theory have begun influencing it in 1950. From 1 April 2001 to 1 July 2014, the warming trend on the mean of the 5 global-temperature datasets is nil. No warming for 13 years 4 months. Recent extreme weather cannot be blamed on global warming, because there has not been any global warming. It is as simple as that.
Technical note
Our latest topical graph shows the RSS dataset for the 214 months October 1996 to August 2014 - just over half the 428-month satellite record.
Terrestrial temperatures are measured by thermometers. Thermometers correctly sited in rural areas away from manmade heat sources show warming rates appreciably below those that are published. The satellite datasets are based on measurements made by the most accurate thermometers available platinum resistance thermometers, which not only measure temperature at various altitudes above the Earth’s surface via microwave sounding units but also constantly calibrate themselves by measuring via spaceward mirrors the known temperature of the cosmic background radiation, which is 1% of the freezing point of water, or just 2.73 degrees above absolute zero. It was by measuring minuscule variations in the cosmic background radiation that the NASA anisotropy probe determined the age of the Universe: 13.82 billion years.
The graph is accurate. The data are lifted monthly straight from the RSS website. A computer algorithm reads them down from the text file, takes their mean and plots them automatically using an advanced routine that automatically adjusts the aspect ratio of the data window at both axes so as to show the data at maximum scale, for clarity.
The latest monthly data point is visually inspected to ensure that it has been correctly positioned. The light blue trend line plotted across the dark blue spline-curve that shows the actual data is determined by the method of least-squares linear regression, which calculates the y-intercept and slope of the line via two well-established and functionally identical equations that are compared with one another to ensure no discrepancy between them. The IPCC and most other agencies use linear regression to determine global temperature trends. Professor Phil Jones of the University of East Anglia recommends it in one of the Climategate emails. The method is appropriate because global temperature records exhibit little auto-regression.
Dr Stephen Farish, Professor of Epidemiological Statistics at the University of Melbourne, kindly verified the reliability of the algorithm that determines the trend on the graph and the correlation coefficient, which is very low because, though the data are highly variable, the trend is flat.
Other statistical methods might be used. A paper by Professor Ross McKitrick of the University of Guelph, Canada, published at the end of August 2014, estimated that at that date there had been 19 years without any global warming.
 

Amir Mohsen

متخصص بخش هواشناسی
تصویری از فعالیت سیستم اخیر در ایتالیا:

Ore 8 circa, la cella vista dalla laguna di Venezia località Punta Sabbioni (Ve)
22w.jpg

33w.jpg

foto di Giuliano Nardin
--
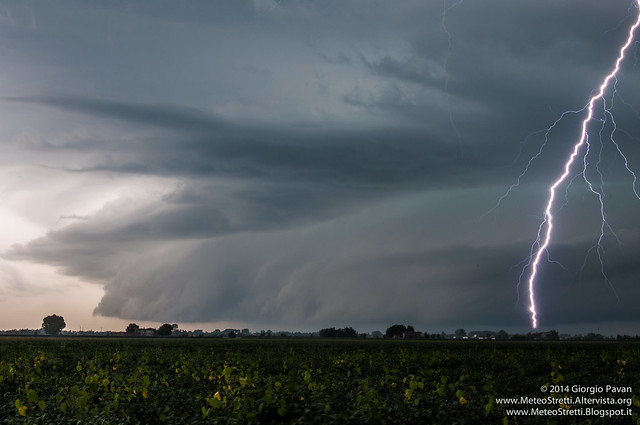
Dopo circa un'ora avanza da sud ovest un altro temporale, le fulminazioni sono impressionanti anche in pieno giorno.
Foto da Ponte Crepaldo (VE) di Giorgio Pavan


-----


Qui la supercella è al suo apice. Località Brian (VE).
Le bande nuvolose rugose mostrano la rotazione antioraria in atto del mesociclone sulla sinistra. A destra il downdraft (corrente discendente) con le forti precipitazioni e una slanciatissima beaver's tail ( nota nefologica in fondo all'articolo)
Foto di Giorgio Pavan
--------------

Nelle prime ore del pomeriggio circa nella stessa zona si forma un shelf cloud molto bassa


--

Wall cloud Torre di Fine (VE


--

Ore 14 circa, la wall cloud arriva a Eraclea Mare e inizialmente genera un funnel cloud, poi genera tre trombe d'aria consecutivamente:


la prima, foto di Sara Vinale
---


Amir Mohsen

متخصص بخش هواشناسی
Picture This: Rainbows, Rainbows & More Rainbows
  • Published: September 5th, 2014
153 74 77 0


By Andrea Thompson
Follow @AndreaTWeather
We can’t seem to go a week without a storm producing one amazing photo of a rainbow or another, be they of the single, double or triple variety. This week was no exception, as you will see below, with three stunning shots. Of course, plenty of other weather phenomena produced wow-worthy images of their own. There’s always something amazing to see up in the sky.
[h=3]Wow, What a Rainbow Weather photographer Brian Miner snapped our first rainbow shot of the week, and it’s a truly outstanding one. In it, the arc of the rainbow stretches across a verdant field behind a squall line in Kansas. Miner saw the rainbow after he had moved to the back of the lines of storms to avoid hail. He backed into a driveway for a barn, set up his camera, wrapping it in a rain poncho, and then sat under the hatch of his SUV, he told Climate Central. Serendipitously, at the moment Miner took the photo, lightning — which he said was everywhere in the area — shot out from the storm clouds, almost appearing to emanate from the rainbow itself. Truly awesome.
Weather photographer Brian Miner snapped this image in Kansas after a squall line blew through but while it was still producing lightning.
Click image to enlarge. Credit: Brian Miner

[h=3]Capital Sunrise The next photo also has plenty of wonderful color, in the form of bright pink skies over the nation’s capital at sunrise.
The reds and oranges that can color the skies at sunset and sunrise are the result of the way air particles scatter incoming light from the sun. During the day, those particles preferentially scatter light toward the blue-violet end of the spectrum, which is why the daytime sky appears blue. But at the beginning and end of the day, those solar rays have a longer path to travel through the atmosphere, and those blues and violets are scattered out, allowing the reds at the other end of the light spectrum through.
When clouds are in the sky at sunset and sunrise, they can enhance the spectacle, acting like projector screens for the colors to fall on.
 

Ahmad7777

New member
سلام دوستان.من بعد از دو ماه برگشتم.غیبتمم به خاطر کنکورم بود.ولادت با سعادت امام رضا رو به همه دوستان تبریک میگم.:گل::گل::گل::گل:
 

Amir Mohsen

متخصص بخش هواشناسی
سلام دوستان.من بعد از دو ماه برگشتم.غیبتمم به خاطر کنکورم بود.ولادت با سعادت امام رضا رو به همه دوستان تبریک میگم.:گل::گل::گل::گل:


سلام احمد عزیز
خیلی خوشحالم مجددا در خدمت تون هستیم.
با سلام خدمت تمام اعضای محترم سایت.

سلام دوست عزیز

خیی خوش اومدید . میشه بفرمایید از کدوم شهر هستید؟
 
وضعیت
موضوع بسته شده است.
بالا