• توجه: در صورتی که از کاربران قدیمی ایران انجمن هستید و امکان ورود به سایت را ندارید، میتوانید با آیدی altin_admin@ در تلگرام تماس حاصل نمایید.

مباحث عمومی هواشناسی- خرداد ماه 1393

وضعیت
موضوع بسته شده است.

Amir Mohsen

متخصص بخش هواشناسی
آخرین پیش بینی CFSv2 منتشر شده در سایت NOAA به تاریخ دیروز بعد از ظهر - ماه جولای:


CFSv2.T2m.20140605.201407.gif


CFSv2.Prec.20140605.201407.gif


اینهم پروجکشنی هست که من در ماه گذشته میلادی برای آنومالی بارش در ماه جولای 2014 مدل سازی کردم:


شباهت بسیار بالاست با پیش بینی جدید CFSv2 :


vbk7tows6kuaeqhxdozg.png
 

Amir Mohsen

متخصص بخش هواشناسی
Occurrence of El Niño 2014 Still on Track, Becomes Established by August


  • [*=center]05
    [*]Start


447327-farmers-plant-rice-at-a-field-near-banda-aceh-in-this-december-11-2012.jpg


[h=3]Occurrence of El Niño 2014 Still on Track, Becomes Established by AugustIt seems there is really no more stopping an El Niño 2014 occurrence. Latest updates released by weather experts from the Australian Bureau of Meteorology and the U.S.' NOAA point to an El Niño becoming established in the Pacific Ocean by August.

The Climate Prediction Center, an agency of the National Weather Service, in its monthly El Niño forecast discussion, said "forecasters remain just as confident that El Niño is likely to emerge."

It said this year's El Niño has a 70 per cent chance developing by the fall or winter.

However, models showed the looming El Niño could most likely be only of moderate strength on the basis that they have yet to see the atmospheric inter-action necessary to claim this particular weather event will really be a big one.

"We are slightly favouring a moderate strength El Niño. While we are not ruling it out at this point, we are not expecting to see the next great El Nino," Mike Halpert, acting director of the Climate Prediction Centre, said.

"We are on the precipice of actually having it here. The ocean has reached the minimum temperature but we are waiting to see the interaction with the atmosphere," Halpert said. "It is certainly within the realm of possibility that it does become a very strong event but it would take some interaction with the atmosphere that we are not seeing right now."

A statement issued by Australian Bureau of Meteorology (BoM) early this week said surface temperature (SST) in the tropical Pacific Ocean continued to increase steadily since February. SST anomalies or the variance to the long term average now goes beyond +0.5 °C, it said.

The US National Oceanic and Atmospheric Administration (NOAA), in the meantime likewise said this week that SSTs are above "average across the equatorial Pacific Ocean,"

It noted tropical rainfall is "near average across Indonesia and the tropical Pacific." Moreover, the chance of El Nino "increases during the remainder of the year, exceeding 65 per cent by summer."

The Climate Prediction Center said on Thursday if it pushes through, the El Niño weather pattern will strike during the Northern Hemisphere summer.

Independent weather experts strongly believe the 2014 El Niño will indeed happen, but only moderately.

"We are going to have an El Niño. The question is the strength," Kevin Trenberth, a climate scientist at the National Centre for Atmospheric Research, was quoted by the Guardian. "It hasn't taken off in the last month the way one might have thought if it was going to be a really major event."


Amir Mohsen

متخصص بخش هواشناسی

EL NIÑO/SOUTHERN OSCILLATION (ENSO)


[TR]
[TD="align: center"]DIAGNOSTIC DISCUSSION[/TD]
[/TR]
[TR]
[TD="align: center"]issued by
CLIMATE PREDICTION CENTER/NCEP/NWS
and the International Research Institute for Climate and Society
[/TD]
[/TR]
[TR]
[TD="align: center"]5 June 2014[/TD]
[/TR]
[TR]
[TD][/TD]
[/TR]
[TR]
[TD]
ENSO Alert System Status: El Niño Watch

[/TD]
[/TR]
[TR]
[TD][/TD]
[/TR]
[TR]
[TD]Synopsis: The chance of El Niño is 70% during the Northern Hemisphere summer and reaches 80% during the fall and winter.
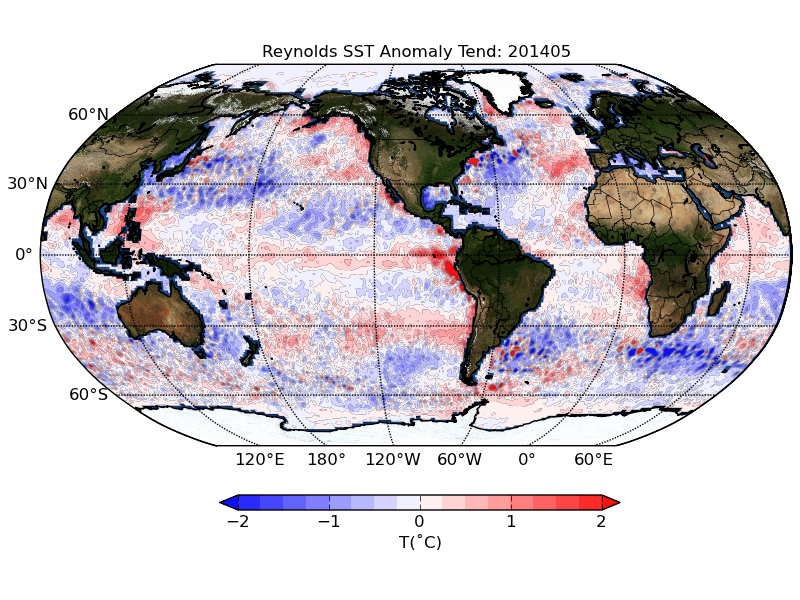
Above-average sea surface temperatures (SST) expanded over the equatorial Pacific Ocean during May 2014 (Fig. 1), though the collective atmospheric and oceanic state continued to reflect ENSO-neutral. All of the Niño indices increased during the month, with the latest weekly values between 0.6[SUP]o[/SUP]C and 1.6[SUP]o[/SUP]C (Fig. 2). In contrast, subsurface temperature anomalies decreased over the last two months (Fig. 3), but still reflect a large pool of above-average temperatures at depth (Fig. 4). The low-level winds over the tropical Pacific remain near average, except for westerly anomalies over the eastern Pacific. At upper-levels, anomalous easterly winds have predominated over most of the equatorial Pacific. Unlike the previous month, convection was near average across most of the tropics (Fig. 5). The lack of a clear atmospheric response to the positive SSTs indicates ENSO-neutral, though the tropical Pacific continues to evolve toward El Niño.
Over the last month, the chance of El Niño and its ultimate strength weakened slightly in the models (Fig. 6). Regardless, the forecasters remain just as confident that El Niño is likely to emerge. If El Niño forms, the forecasters and most dynamical models, such as NCEP CFSv2, slightly favor a moderate-strength event during the Northern Hemisphere fall or winter (3-month values of the Niño-3.4 index between 1.0[SUP]o[/SUP]C and 1.4[SUP]o[/SUP]C). However, significant uncertainty accompanies this prediction, which remains inclusive of a weaker or stronger event due to the spread of the models and their skill at these lead times. Overall, the chance of El Niño is 70% during the Northern Hemisphere summer and reaches 80% during the fall and winter (click CPC/IRI consensus forecastfor the chance of each outcome).
This discussion is a consolidated effort of the National Oceanic and Atmospheric Administration (NOAA), NOAA’s National Weather Service, and their funded institutions. Oceanic and atmospheric conditions are updated weekly on the Climate Prediction Center web site (El Niño/La Niña Current Conditions and Expert Discussions). Forecasts are also updated monthly in the Forecast Forumof CPC's Climate Diagnostics Bulletin. Additional perspectives and analysis are also available in an ENSO blog. The next ENSO Diagnostics Discussion is scheduled for 10 July 2014. To receive an e-mail notification when the monthly ENSO Diagnostic Discussions are released, please send an e-mail message to:ncep.list.enso-update@noaa.gov.
[/TD]
[/TR]
[TR]
[TD][/TD]
[/TR]
[TR]
[TD="align: center"]Climate Prediction Center
National Centers for Environmental Prediction
NOAA/National Weather Service
College Park, MD 20740

[/TD]
[/TR]


Amir Mohsen

متخصص بخش هواشناسی
2014 June Quick Look[h=2]CPC/IRI Consensus Probabilistic ENSO Forecast[h=3]June 5, 2014
figure1.gif

[h=3]CPC/IRI Early-Month Consensus ENSO Forecast Probabilities
SeasonLa NiñaNeutralEl Niño
MJJ 2014~0%39%61%
JJA 20141%30%69%
JAS 20141%26%73%
ASO 20141%22%77%
SON 20141%19%80%
OND 20141%17%82%
NDJ 20141%17%82%
DJF 20142%18%80%
JFM 20152%22%76%


Amir Mohsen

متخصص بخش هواشناسی
[h=2]Details on the June 2014 ENSO discussion


Author:
Emily Becker


Thursday, June 5, 2014


Today, the Climate Prediction Center (CPC) released the June ENSO Diagnostic Discussion. Chances that an El Niño will occur by summer are above 70%, and reach 80% by the fall. Sea-surface temperature anomalies increased across all the Niño index regions in May; the latest weekly value of the Niño3.4 index is now above +0.5°C. Tropical rainfall across Indonesia and the Pacific remain close to average, but forecasters are confident that the atmosphere will begin to respond to the ocean and El Niño will develop, likely in the next few months.
Recently, there’s been a lot of speculation about how strong this El Niño will be, especially considering the strong westerly wind bursts in late winter, and the large subsurface temperaturesin early spring. The subsurface temperatures in March, which was a record for the month going back to 1979, inspired comparisons to the early stages of the 1997/98 El Niño, the largest on record (ONI maximum of 2.4). That event also developed in the spring, like this one. However, right now, forecasters are not favoring a strong event (while not at all ruling it out) and believe a moderate event (ONI 1.0 - 1.5) is slightly more likely, sometime during the fall/winter. So what’s going on?
First, the subsurface temperatures have tapered off a bit recently (Figure 1). While still substantially above normal, the average of the upper-ocean (300m to surface) temperatures in the tropical Pacific has decreased over the past two months. SSTs tend to lag this measurement, often by a few months and with lesser intensity.
Figure 1: Equatorial ocean upper 300-meter temperature average anomaly during January-December of 1997 and 2014.


The difference between 1997 and 2014 are also illustrated by the May cross-sections of temperature anomaly along the equator (Figure 2). If you’re interested, you can check out the history of ocean temperature anomalies and compare other El Niño events, such as 2002/03 or 2009/10, at a new CPC site.
Figure 2. Subsurface temperature (degrees C) cross-sections from May 1997 (left) and 2014 (right). The figures are showing the average of several different subsurface temperature datasets. Maps based on data from theReal Time Multiple Ocean Reanalysis Intercomparison website.


Another factor the forecasters are considering is the model guidance. Most climate models are predicting a weak-to-moderate event, with dynamical models slightly favoring a moderate event and statistical models favoring a weaker event. The ensemble mean of NCEP’s Climate Forecast System, CFSv2 (Figure 3, black dashed line) has been fairly consistent in forecasting Niño3.4 anomalies in the range of 1.0-1.5°C, but, as you can see from the individual model runs (blue, red, and gray lines), there is an envelope of possible values from 0°C to slightly above 2.0°C.
Figure 3. Predicted departures from seasonal (3-month) average temperature for the Niño3.4 region of the tropical Pacific through the remainder of 2014. Plot based on data from the NCEP coupled forest system (CFS) version 2.


We’re beginning to move beyond the “spring barrier” (when models have a harder time accurately predicting future conditions) and will be watching the ENSO model forecasts closely going forward. Regardless, predicting the peak strength tends to be the most difficult part of ENSO forecasting.
So... if we have an El Niño by this fall, be it weak, moderate, or strong, what does it portend for the wintertime precipitation and temperature over the U.S.? Stay tuned - we’ll have a post about this very topic within the next week.
Thanks to Yan Xue for her help with this post.


DR WHO

کاربر ويژه
پس چرا مولفه اتمسفرى انسو داره روبه لانينا ميره ؟!!!

مولفه اتمسفرى انسو با مولفه اقيانوسى انسو الان در تضاد هست !!! دماى مناطق حاره اى روبه ال نينو ميرن ولى SOI روبه لانينا !!!


به نظرم نظرم بهترين زمان براى ارزيابى وضعيت انسو و IOD اواخر شهريور هست :گل: چون احتمال داره تا اون موقع اوضاع اقيانوس ها به هر دليلى هزار بار دگرگون بشه !
 

Amir Mohsen

متخصص بخش هواشناسی
اگه خاطر دوستان باشه من تاکید میکردم که النینو متوسط همانند سال 1992 در انتظار مون هست که آخرین اطلاعات حکایت از وقوع یک النینو متوسط داره که با شانس 70 درصد از آگوست آغاز میشه و این النینو حداقل تا پایان زمستان سال 2015 با شانس 80 درصد ادامه خواهد یافت.

در حال حاضر وضعیت بارش در محدوده اندونزی در حد نرمال این موقع از سال هست ولی هرچه زمان جلوتر بره تاثیر پذیری این بارش ها از پدیده النینو افزایش پیدا کنه و تمایل به کمتر از نرمال پیدا میکنه.

در مقاله بالا تاکید شاید یک النینو در حد النینو سال 2002-2003 و یا 2009-2010نیز احتمال وقوع خواهد داشت. . بهرحال میتونم برم یک پروجکشن جدید بر اساس این سالها هم آنالوگ سازی کنم تا ببینیم وضعیت بر چه منوال خواهد گذشت.
 

AFSORDE

کاربر ويژه
درود بر شما مهربان ياران :گل:

به نظر من بعد از اين خرداد خنك ، تير و مرداد آتشين خواهد آمد .


اوضاع آب و هوايى بسيار سينوسى شده


البته از نظر اقليمى و تجربه اى هيچگاه دو تابستان پشت سر هم بسيار داغ نمى شوند ولى به نظر بنده اين خنكى خرداد موقتى ست و بزودى

ايران جهنم خواهد شد .

موافقم امیرکورش جان... مثلا تابستان 88، و بعد تابستان 89 که تیرماه خیلی گرمی داشت و تابستان 90 که در بیشتر نقاط کشور به خصوص شمال غرب یکی از گرمترین تابستان ها بود. :104:
هر سه این تابستان ها دوره های گرم داشتن بطور کلی گرم بودن و خنک نبودن.

ولی دوره اوج گرما در هر کدام از این تابستان ها متفاوت بود.... این خودش مهمترین اصل هست به نظر من، مثلا حداکثر دمای مطلق تابستان 91 در اصفهان از حداکثر مطلق تابستان 89 و 90 بیشتر بود ولی تدارم حداکثر دمای تابستان 91 فقط 2 روز بود! تابستان 92 هم از نظر دمایی بالا بود و هم مدت زمان اون که هفته ها به طول انجامید. همانطور که زمستانش هم چنین شرایطی داشت ولی از نظر سرما.

تابستان 88 تیر و مرداد گرمی داشت و شهریور پربارش و نسبتا خنک، تابستان 89 تیرماه خیلی گرم و مرداد خنک، و.....


شرمنده البته :atish:
 
آخرین ویرایش:

شهاب از بوشهر

کاربر ويژه
درود

دوستان عزیز و امیر محسن جان ، کسی سایتی یا نرم افزاری را سراغ دارد که بتواند میزان حجم عکس ها و نقشه ها رو کاهش بده.

البته بدون افت کیفیت عکس.

خیلی خیلی لازم دارم و نیازمندم.

امیر جان دستم به دامنت.

کمکم کن.
 

Amir Mohsen

متخصص بخش هواشناسی
درود

دوستان عزیز و امیر محسن جان ، کسی سایتی یا نرم افزاری را سراغ دارد که بتواند میزان حجم عکس ها و نقشه ها رو کاهش بده.

البته بدون افت کیفیت عکس.

خیلی خیلی لازم دارم و نیازمندم.

امیر جان دستم به دامنت.

کمکم کن.

بهترین گزینه دکمه پرینت اسکریت بر روی کیبورد هست بعد در فضای paint باید paste کنید و اضافه های عکس رو کات کنید و در انتها هم ذخیره مثا این عکس من هم همین کار رو کردم:


pnf9c8h57xyqndyzznyz.jpg


کیفیت تغییر نکرده و حجم عکس 128 کیلوبیت شده
 
وضعیت
موضوع بسته شده است.
بالا