[h=2]17.06.2014
17.06.2014 07:40 Age: 2 hrs
[h=2]

Click to enlarge. Warming is levelling off. Current (17 June 2014) NOAA computer forecast. A positive gradient into the future indicates warming and a negative gradient cooling. Courtesy: NOAA.

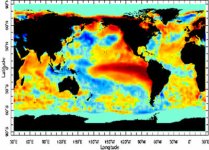
Click to enlarge. Monthly sea surface temperature anomaly map and monthly sea surface temperature anomaly data. Courtesy: BoM

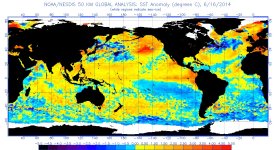
Click to enlarge. Weekly sea surface temperature anomaly map and weekly sea surface temperature anomaly data. Courtesy: BoM

Click to enlarge. Monthly sub-surface temperatures. Courtesy: BoM

Click to enlarge. Five day graph of sub-surface temperatures. Courtesy: BoM

Click to enlarge. Southern Oscillation Index (SOI) 30 day moving average. Courtesy: BoM

Click to enlarge. Trade winds. Sea surface temperatures and winds. Five days ending 1 June 2014. Courtesy: BoM

Click to enlarge. Cloud cover near the dateline. Courtesy: BoM

Click to enlarge. Computer model forecast for El Nino. A positive gradient into the future indicates warming and a negative gradient cooling. Courtesy: BoM

Click to enlarge. Computer model forecast for Indian Ocean Dipole. Courtesy: BoM
A degree of uncertainty now exists over the development of the expected El Nino Pacific Ocean warming event this year following the release of new data.
For the last month or so, both the National Oceanic and Atmospheric Administration (NOAA) of the US and Australia's Bureau of Meteorology (BoM) have been predicting that an El Nino is likely to develop in the Pacific later this year as a large bubble of warm water rises off Indonesia and moves eastwards towards the western coast of the Americas.
However, Pacific Ocean sea surface warming has “levelled off” in recent weeks and changes in key measures run “counter to typical El Nino development” while computer model forecasts of the so called El Nino Southern Oscillation (ENSO) have eased, according to BoM. However, “The Bureau's ENSO Tracker remains at El Nino ALERT, indicating at least a 70% chance of El Nino developing in 2014,” states BoM in its most recent report issued today (17 June 2014).
Positive sea surface temperature anomalies (that is, warming) remain evident across much of the Pacific but the area of warmer than average sub surface water that drives El Nino sea surface surface warming has shrunk, according to BoM. It states that “overall there has been a reduction in the area of sub-surface water very much warmer than average over the past month and a half”.
Furthermore, the Southern Oscillation Index (SOI) - a measure of the atmospheric pressure difference between Tahiti and Darwin in Australia and a lead indicator of El Nino conditions - has risen over the past two weeks and has generally remained around +8 to +10. The latest approximate 30-day SOI value to 15 June is +10.3. Sustained positive values of the SOI above +8 may indicate a La Nina Pacific Ocean cooling event rather than a warming event.
Trade winds are also stronger than would be expected in El Nino conditions, says BoM.
While computer model forecasts from both NOAA (see top right) and BoM (see right second from bottom) of future warming have also flattened. “Despite some easing in the predictions of how much the equatorial Pacific will warm by, the majority of the surveyed models indicate that sea surface temperatures in the equatorial Pacific are likely to exceed El Nino thresholds before or during the southern hemisphere spring,” reports BoM.
El Nino events have a global impact on weather and can result in droughts in Australia and India and rainfall in California as well as cooler than usual winters in Europe. They also have an impact on global average surface temperatures. Some climate scientists have suggested that a particularly strong El Nino this year would result in record global surface temperatures in 2014.
Here is the latest report issued by BoM:
[h=4]
Issued on Tuesday 17 June 2014 | Product Code IDCKGEWW00
Warming of the tropical Pacific Ocean over the past several months has primed the climate system for an El Nino in 2014. However, in the absence of the necessary atmospheric response, warming has levelled off in recent weeks. Positive Southern Oscillation Index values and large areas of warm water in the western Pacific and off northwestern Australia are also counter to typical El Nino development.
Despite recent observations and some easing in the model outlooks, climate models surveyed by the Bureau still indicate El Nino is likely to develop by spring 2014. The Bureau's ENSO Tracker remains at El Nino ALERT, indicating at least a 70% chance of El Nino developing in 2014.
For Australia, El Nino is often associated with below-average rainfall over southern and eastern inland areas and above-average daytime temperatures over southern parts of the continent.
The Indian Ocean Dipole (IOD) is currently neutral. Model outlooks suggest the IOD is most likely to remain neutral through winter and spring. Positive IOD events often coincide with El Niño and are typically associated with large parts of southern and central Australia experiencing lower rainfall than usual.
[h=4]The equatorial Pacific continued to warm during May. The sea surface temperature (SST) anomaly map for May shows warm anomalies are present in the Pacific along nearly the entire equator as well as to Australia’s northwest and around much of the Maritime Continent to Australia’s north. Compared to last month, anomalies in the eastern tropical Pacific and around the Date line have shown the most warming.
[h=4]Warm SST anomalies are in place across the entire tropical Pacific Ocean, though a slight cooling has occurred in the central areas over the past fortnight. Positive anomalies remain evident across large areas north of the equator in both the East China Sea in the west and along the North American coastline in the east (see SST anomaly map for the week ending 15 June). Warm anomalies also extend into the Indian Ocean.
[h=4]The four-month sequence of sub-surface temperature anomalies (to May) shows warm temperature anomalies across the top 150 m of the equatorial Pacific between the Date Line and the South American coast. Sub-surface waters are more than 4 °C warmer than average in several parts of the central and eastern equatorial Pacific.
[h=4]The sub-surface temperature map for the 5 days ending 15 June shows waters in the eastern half of the equatorial Pacific are warmer than average in the top 100 m. Water in an area of the sub-surface in the far eastern equatorial Pacific remains more than 5 °C above average around 50 m depth. Elsewhere, the sub-surface is generally near average.
As shown in the animation of sub-surface temperature changes, this pool of warmer-than-average sub-surface water has been present in the eastern tropical Pacific for a number of weeks and is likely to sustain the surface warming in the region during winter. However, overall there has been a reduction in the area of sub-surface water very much warmer than average over the past month and a half.
[h=4]The Southern Oscillation Index (SOI) has risen over the past two weeks and has generally remained around +8 to +10. The latest approximate 30-day SOI value to 15 June is +10.3.
Sustained positive values of the SOI above +8 may indicate a La Nina event, while sustained negative values below −8 may indicate an El Nino event. Values of between about +8 and −8 generally indicate neutral conditions.
Trade winds are stronger than average over the far western tropical Pacific, and near-average across the remainder of the tropical Pacific (see anomaly map for the 5 days ending 15 June).
During La Nina events, there is a sustained strengthening of the trade winds across much of the tropical Pacific, while during El Nino events there is a sustained weakening of the trade winds.
[h=4]Trade winds are stronger than average over the far western tropical Pacific, and near-average across the remainder of the tropical Pacific (see anomaly map for the 5 days ending 15 June).
During La Nina events, there is a sustained strengthening of the trade winds across much of the tropical Pacific, while during El Nino events there is a sustained weakening of the trade winds.
[h=4]Cloudiness near the Date Line has continued to fluctuate around the long-term average during the past two weeks.
Cloudiness along the equator, near the Date Line, is an important indicator of ENSO conditions, as it typically increases (negative OLR anomalies) near and to the east of the Date Line during an El Niño event and decreases (positive OLR anomalies) during a La Niña event.
[h=4]Most international climate models surveyed by the Bureau indicate that SSTs in the equatorial Pacific Ocean are likely to warm further over the coming months. Despite some easing in the predictions of how much the equatorial Pacific will warm by, the majority of the surveyed models indicate that sea surface temperatures in the equatorial Pacific are likely to exceed El Niño thresholds before or during the southern hemisphere spring.
[h=4]The Indian Ocean Dipole (IOD) remains neutral, with the latest weekly index value (15 June) −0.4 °C.
Climate models surveyed in the model outlooks favour neutral IOD values over the coming months, though one model reaches positive IOD levels in the spring. The chance of a positive IOD event is elevated during an El Niño. Positive IOD events often coincide with El Niño and are typically associated with lower than average winter and spring rainfall over parts of southern and central Australia.
[h=4]


