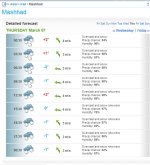
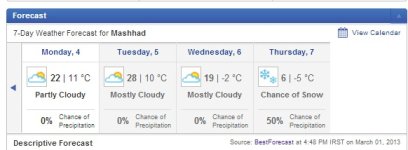
سلام.ینی عمرا اگه بشه.این همه وقت نیومده الان میخاد بیاد.:تعجب:
-
توجه: در صورتی که از کاربران قدیمی ایران انجمن هستید و امکان ورود به سایت را ندارید، میتوانید با آیدی altin_admin@ در تلگرام تماس حاصل نمایید.
You are using an out of date browser. It may not display this or other websites correctly.
You should upgrade or use an alternative browser.
You should upgrade or use an alternative browser.
مباحث عمومی هواشناسی
- شروع کننده موضوع Amir Mohsen
- تاریخ شروع
- وضعیت
- موضوع بسته شده است.
سلام.ینی عمرا اگه بشه.این همه وقت نیومده الان میخاد بیاد
امیدوارم اتفاق بیفته اخره سالی یه برفی ببینیم.:گل:
آره مهرداد جان مطمئن ترین نقطه برا عکس و هر فایلیه به نظر منم یادمه 1389 یا اوایل 90 بود که بعد از توصیه مهرداد توش عضو شدم و واقعا هم راضیم باوجود قطع و وصل های متناوب ی که داره.
درسته ترافيك سايت پرشین گیگ پائينه و حتي برخي مواقع عكس ها رو نمايش نمي ده اما مطمئن ترين هاست براي نگهداري فايل ها براي هميشه ست و خودت مي توني بر روي فايل هاي آپلود شده مديريت داشته باشي من عكس هاي سال هاي پيش رو هنوز توي اين هاست دارم بدون هيچ عيبي.
به هر حال اين پيشنهاد بود :گل:
خوب امروز طرف های ساعت 1100 بود بیرون رفتم و حس بهار بهم دست داد واقعا از همون حس همیشگی که تو این فصل بهم دست می ده احساس تولد و زندگی دوباره و مجددا به یاد این دموی زیبا افتادم
امروز سمت اشتهارد و نظر آباد و هشتگرد در غرب استان البرز رفتم خوب هوا در کل مسیر ابری گاها بارون های ماشین کثیف کن وجود داشت می خواست طالقان هم برم خوب فرصت نشد گفتم به شب می خورم خوب جالبترین نکته در کل مسیر شوره زار و نمک زارهای مسیر بین اشتهارد و نظر آباد بود عکس نتونستم زیاد بگیرم. خلاصه تجربه ای بود کاشکی بجای رانندگی بی هدف مستقیم به طالقان و یا سمت تهران می اومدم خوب تجربه بود .
بگذریم امروز بحث کلاغ بود جالبه تو کل این مسیر نتونستم یک دونه کلاغ هم ببینم به یکباره یک نژاد منحوس کلاغ رو دیدم و علتش رو فهمیدم
خوب اینم عکسش حالا شما بگید چرا؟

Amir Mohsen
متخصص بخش هواشناسی
کلا نقشه های ECMWF سایت آندر گراند شروع بارش برف در مشهد و قوچان رو تقریبا همزمان باهم و از غروب روز چهارشنبه اعلام کردند:


ali.doosti
کاربر ويژه
سلام...
برای اولین بار تو عمرم طوفان شنو بین بیابونای اهواز آبادان دیدم...
اینقد خوف بود که نگو...الانم دپرسم بارش نداریم :|
برای اولین بار تو عمرم طوفان شنو بین بیابونای اهواز آبادان دیدم...
اینقد خوف بود که نگو...الانم دپرسم بارش نداریم :|
Amir Mohsen
متخصص بخش هواشناسی
Cold front at 800 hPa (green)
Cold front at 700 hPa (purple)
Jet stream at 300 hPa (black)

The vertical motion along the east-west cross-section (red arrow above )through the front has the following characteristics:
Vertical cross-section (along the red arrow on the above map) of the vertical motion (10[SUP]-1[/SUP] Pa/sec)

Amir Mohsen
متخصص بخش هواشناسی
TEMPERATURE ADVECTION
There is a contribution to upward motion where:
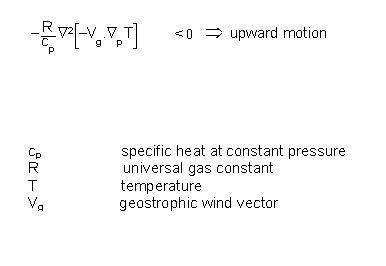
This condition is fulfilled if
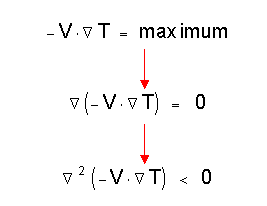
Therefore a contribution to upward motion exists in the maxima of warm advection (WA) which guides an evaluator to look for these maxima in a numerical temperature advection (TA) field.
Typical cloud configurations which are completely or partly connected with this parameter are:
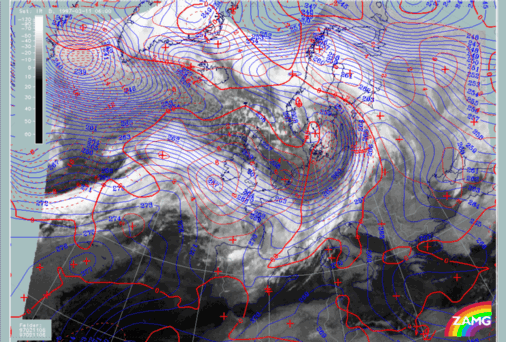
Some practical examples can be found in the test case from 11 February 1997/06.00 UTC.
The following features should to be noted:
Two aspects have to be considered when comparing the two parameters in relation to satellite imagery:
by ZAMG
There is a contribution to upward motion where:

This condition is fulfilled if

Therefore a contribution to upward motion exists in the maxima of warm advection (WA) which guides an evaluator to look for these maxima in a numerical temperature advection (TA) field.
Typical cloud configurations which are completely or partly connected with this parameter are:
- Warm Fronts
- Conveyor belts
- Cloudiness in thickness ridges
- Waves
- Rapid Cyclogenesis
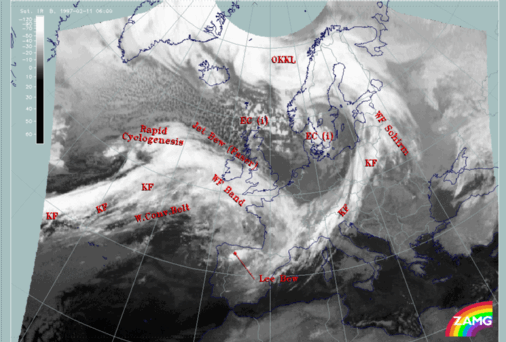
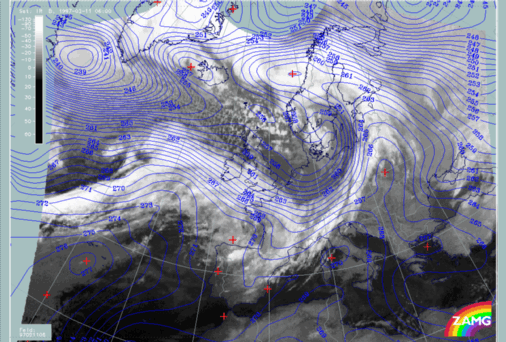
Some practical examples can be found in the test case from 11 February 1997/06.00 UTC.
| 11 February 1997/06.00 UTC - Meteosat IR image; SatRep overlay: names of conceptual models | 11 February 1997/06.00 UTC - Meteosat IR image; blue: temperature 700 hPa |
|
|
The following features should to be noted:
- Zones of high temperature gradient (crowded zones of temperature isolines) are connected with frontal cloud bands. They indicate the transition between air masses with different temperatures and can be found in this example with:
- The Cold Fronts ("KF") over the Atlantic and Central Europe:
The zone of high gradients over the Atlantic is broad possibly indicating two developing frontal zones;
The zone of high gradients over Central Europe is distinct and partly within, partly behind the cloud band. - the Warm Front ("WF Band"); the distinct zone of high temperature gradients coincides with the cloud band.
- The Cold Fronts ("KF") over the Atlantic and Central Europe:
- Ridges indicating high temperatures can usually be found in front of Cold Fronts and in association with occlusion bands where they indicate the lifting of warm air, in agreement with the classical ideas of Occlusion development, and/or the mixing of warm and cold air masses. The following areas are good examples:
- Over the Balkan States and East Europe in front of the Cold Front over Central Europe;
- Over the Atlantic in front of the Atlantic Cold Front and behind the Warm Front;
- From the Baltic States across Finland and Scandinavia into the Norwegian Sea which is associated with the cloud band of an Occlusion (named "OKKL").
- Troughs indicating low temperatures can usually be found behind the frontal zones:
- Over Denmark, Germany and Poland behind the Cold Front over Central Europe.

Two aspects have to be considered when comparing the two parameters in relation to satellite imagery:
- The relation between temperature at 700 hPa and temperature advection 500/1000 hPa
- The relation of temperature advection to the cloud systems
- Warm advection (WA) can be found in front of the ridge lines of the ridges of high temperature indicating the movement of the warmest air in the ridge line:
- This is very clear for the temperature ridge from the Balkan States across Scandinavia; the main maxima of WA can be found over the Baltic States, Finland and N. Scandinavia;
- Two typical cloud configurations are connected with the WA maxima:
- Warm Front bands or shields (in this case the one named "WF Schirm")
- Occlusion bands (in this case the one named "OKKL")
- The very pronounced WA maximum reaching from Ireland into the Gulf of Biscay indicates the east, north-eastward movement of the warmest air found in the ridge over the Atlantic (approximately 40N/26W - 50N/18W); two cloud configurations are connected with the WA maximum:
- The Warm Front Band ("WF Band") with dense cloudiness
- the Warm Conveyor Belt (labelled "W.Conv.Belt") with more fibrous cloudiness in front of the frontal system; this will be disussed in more detail later under the chapter of relative streams (compare Relative Streams ).
- The distinct smaller scale WA maximum in the region of the Rapid Cyclogenesis indicates the advection of the warm air forming the small scale temperature ridge within the frontal crowding zone (approximately 50N/24W - 55N/30W); this WA maximum is connected with secondary cyclogenesis taking place in a Wave development or (as is the case here) within a more rapid development, the Rapid Cyclogenesis
- Cold advection (CA) can be found in front of the cold air troughs starting at the trough line; this indicates the propagation of the coldest air which can be found in the temperature trough. The following examples should be noted:
- Pronounced CA behind the cold front over Central Europe east of the ridge line from Denmark southward to Central France;
- There are only few clouds in the main part of the trough
- The region over the Alpine area is accompanied by frontal cloudiness but with lower cloud tops indicating dissolution of cloudiness from above
- Pronounced CA exists north and north-west of the Rapid Cyclogenesis representing the propagation of the cold air more to the north-west; this is the typical wide area filled with regular cold air cloud cells; they are created where the cold air flows over relatively warm water. Small-scale convective processes are the reason for cloud development but the bigger scale sinking motion restricts the further growing of the cloud cells. Consequently they have warmer cloud tops than the frontal cloud bands.
- A small scale CA area close to the Rapid Cyclogenesis (centred approximately around 48N/27W). There is a typical juxtaposition of a mesoscale WA and a CA maximum; this is typical in regions of Wave development and rapid cyclogenesis as is the case here; it indicates the initial advection of warm and cold air masses and a strengthening of cyclonic circulation
- Pronounced CA behind the cold front over Central Europe east of the ridge line from Denmark southward to Central France;
امیدوارم اتفاق بیفته اخره سالی یه برفی ببینیم.:گل:
سلام میلاد جان . گفتم الانه که بیاید پست بدیدا .:خنده1: خدا کنه برف خوبی بیاد .
ali.doosti
کاربر ويژه
پس این سرخ نامرد واس ما هیچی نداره :ناراحت:
دستم بهش برسههههههه!
دستم بهش برسههههههه!
بسیار زیبا بیاد صحنه قدیمی خودم در مسیر گاماسیاب و چهل نابالغان افتادم راستی اسم رود چیه؟بینالود
عکس از wunderground
خوب امروز خیلی دلم گرفته بود نه که یاد نهاوند و کنم فقط یاد یه کوه درست حسابی رو کردم که تا پائین حداقل 2000 متر برف باشه خوب آخه برا من یه کم این طبیعت اینحا سخته دشت و دشت همیشه در خونم مون رو باز می کردم دقیقا از آبان تا تیر چهل نابالغان رو می دیدم که تا نصفه و حتی پائین برف بود و یا حتی گرین های کوچیک تر مثل گیان ( گیاو ) گنبد کبود ( گمه کاو ) فارسبان ( فارسبو ) که کمتر و حدود 5 ماه تا نیمه برف دارند خوب دیگه باید عادت کنم وقت هم نمی شه برم نهاوند همیشه از این سبک زندگی که مجبور به قبول محدودیت های اطرافه متنفر بودم خوب شاید هفته دیگه بزنه سرم برم نهاوند . باز تهران بهتره لااقل تهران یه توچال داره اینجا کوههای برفدارش خیلی دورند
Amir Mohsen
متخصص بخش هواشناسی
RELATIVE STREAMS
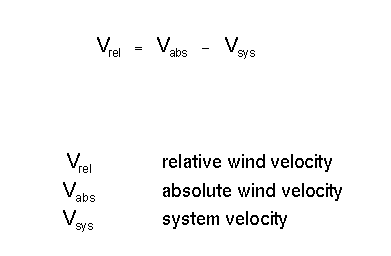
Relative streams on isentropic surfaces have gained more and more importance following the introduction of the concept of conveyor belts. However, until now actual work with relative streams mostly is restricted to research work and is not yet common in operational weather forecasting. Relative streams are streams computed on isentropic surfaces where the potential temperature and/or the equivalent potential temperature is constant relative to a system velocity. This system velocity is subtracted from the absolute velocity:
The determination of the system velocity is one of the critical steps in the computation; it can be derived from the propagation of cloud systems accompanying a weather system. For instance the propagation of the frontal cloud band can be used for the system front and upper level trough.
The subtraction of the system velocity means that an observer would move with the system and that all the air streams and their changes occur relative to this system.
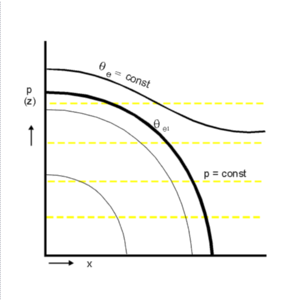
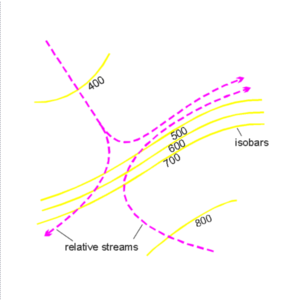
The next schematics explain the connection between presentations on isobaric and isentropic surfaces.
There are two main advantages for an analysis of relative streams:
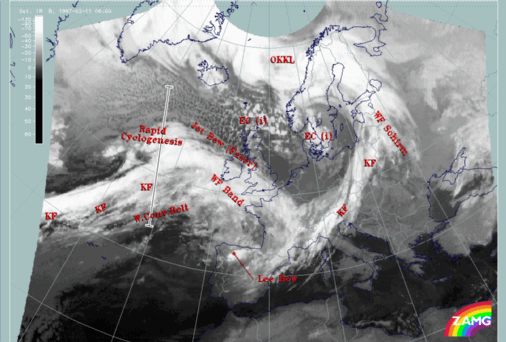
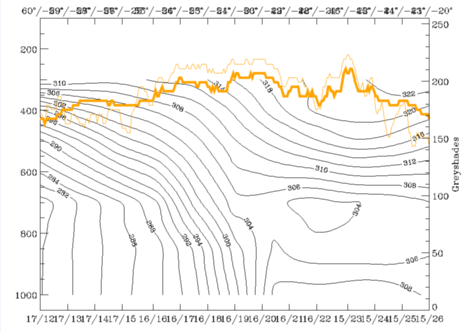
Warm Conveyor Belts and their associated cloudiness are not only involved directly in the frontal systems but appear frequently in the region of high fibrous cloudiness in front of cold fronts in the warm sector. The case study of 11 February 1997/06.00 UTC contains a good example in front of the Atlantic front. Also the conceptual model of the Rapid Cyclogenesis shows some distinct features in the relative streams. Both cloud systems can be used to demonstrate the use and interpretation of relative streams.
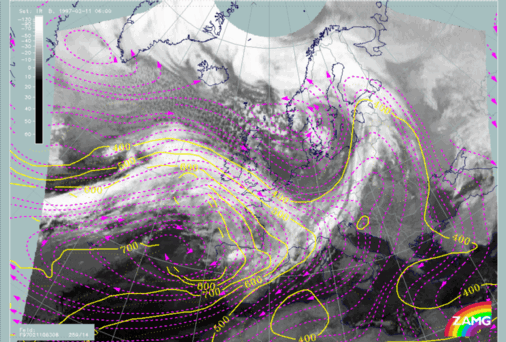
Relative streams at the upper level of 308K (left image) should be indicative of the fibrous cloud system diagnosed as warm conveyor belt ("W.Conv.Belt") and indeed the magenta lines show a relative stream from east (from Spain to about 35W) bending there to the north-east up to about 10W where it bends to the south again. This north-eastward oriented part of the stream in front of the cold front and the southward oriented part behind the Warm Front is accompanied by cloudiness which shows fibrous structure. The orientation of the fibres and other cloud parts coincides quite well with the relative streams there. In the westward oriented branch no distinct vertical motion can be recognized. The eastward oriented branch rises at first slightly. The more it approaches the frontal zone the rising of this relative stream gets even more pronounced. In the Bay of Biscay rising motion from 800 - 700 up to 650 - 550 hPa (yellow lines) occurs. Relative streams within and north of the frontal cloud band clearly show a different origin from behind the Cold Front, therefore different air masses are approaching. Especially in the area of the Rapid Cyclogenesis a relative stream from north-west is involved in these height levels.
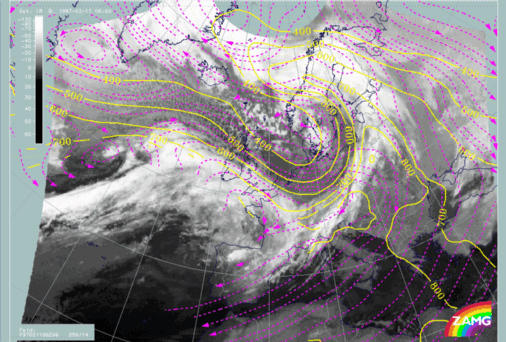
The low isentropic surface of 296K (right image) is representative of the situation in the area of the Rapid Cyclogenesis. It is a surface which is in the centre of the broad frontal zone and reaches the earth surface at grid point 16/18 which is approximately 52N/26W. There are two different relative streams involved: the one from the south rising sharply from the surface up to 550 hPa and bending to the east there; the second shows up as a small cyclonic circulation to the west in the area of the cloud spiral. Both represent a typical configuration for this conceptual model.
by ZAMG
Relative streams on isentropic surfaces have gained more and more importance following the introduction of the concept of conveyor belts. However, until now actual work with relative streams mostly is restricted to research work and is not yet common in operational weather forecasting. Relative streams are streams computed on isentropic surfaces where the potential temperature and/or the equivalent potential temperature is constant relative to a system velocity. This system velocity is subtracted from the absolute velocity:

The determination of the system velocity is one of the critical steps in the computation; it can be derived from the propagation of cloud systems accompanying a weather system. For instance the propagation of the frontal cloud band can be used for the system front and upper level trough.
The subtraction of the system velocity means that an observer would move with the system and that all the air streams and their changes occur relative to this system.
The next schematics explain the connection between presentations on isobaric and isentropic surfaces.
|
|
There are two main advantages for an analysis of relative streams:
- The different air masses involved in a weather system are quasi-visualized through the relative streams which transport them; therefore sharp cloud boundaries and other cloud structures can be easily explained.
- An isentropic surface is a surface of constant potential (or equivalent potential) temperature, which means that air particles on such a surface do not undergo any heat exchange and consequently stay and move on this surface. Therefore rising and sinking can directly be seen on an isentropic surface by noting the isobars which are crossed by the streamlines.
Warm Conveyor Belts and their associated cloudiness are not only involved directly in the frontal systems but appear frequently in the region of high fibrous cloudiness in front of cold fronts in the warm sector. The case study of 11 February 1997/06.00 UTC contains a good example in front of the Atlantic front. Also the conceptual model of the Rapid Cyclogenesis shows some distinct features in the relative streams. Both cloud systems can be used to demonstrate the use and interpretation of relative streams.
| 11 February 1997/06.00 UTC - Meteosat IR image; SatRep overlay: names of conceptual models, position of vertical cross section indicated | 11 February 1997/06.00 UTC - Vertical cross section; black: isentropes (ThetaE), orange thin: IR pixel values, orange thick: WV pixel values |
|
|
|
|
| 11 February 1997/06.00 UTC - Meteosat IR image; magenta: relative streams 308K - system velocity 259° 14m/s, yellow: isobars | 11 February 1997/06.00 UTC - Meteosat IR image; magenta: relative streams 308K - system velocity 259° 14m/s, yellow: isobars |
Relative streams at the upper level of 308K (left image) should be indicative of the fibrous cloud system diagnosed as warm conveyor belt ("W.Conv.Belt") and indeed the magenta lines show a relative stream from east (from Spain to about 35W) bending there to the north-east up to about 10W where it bends to the south again. This north-eastward oriented part of the stream in front of the cold front and the southward oriented part behind the Warm Front is accompanied by cloudiness which shows fibrous structure. The orientation of the fibres and other cloud parts coincides quite well with the relative streams there. In the westward oriented branch no distinct vertical motion can be recognized. The eastward oriented branch rises at first slightly. The more it approaches the frontal zone the rising of this relative stream gets even more pronounced. In the Bay of Biscay rising motion from 800 - 700 up to 650 - 550 hPa (yellow lines) occurs. Relative streams within and north of the frontal cloud band clearly show a different origin from behind the Cold Front, therefore different air masses are approaching. Especially in the area of the Rapid Cyclogenesis a relative stream from north-west is involved in these height levels.
The low isentropic surface of 296K (right image) is representative of the situation in the area of the Rapid Cyclogenesis. It is a surface which is in the centre of the broad frontal zone and reaches the earth surface at grid point 16/18 which is approximately 52N/26W. There are two different relative streams involved: the one from the south rising sharply from the surface up to 550 hPa and bending to the east there; the second shows up as a small cyclonic circulation to the west in the area of the cloud spiral. Both represent a typical configuration for this conceptual model.
بسیار زیبا بیاد صحنه قدیمی خودم در مسیر گاماسیاب و چهل نابالغان افتادم راستی اسم رود چیه؟
خوب امروز خیلی دلم گرفته بود نه که یاد نهاوند و کنم فقط یاد یه کوه درست حسابی رو کردم که تا پائین حداقل 2000 متر برف باشه خوب آخه برا من یه کم این طبیعت اینحا سخته دشت و دشت همیشه در خونم مون رو باز می کردم دقیقا از آبان تا تیر چهل نابالغان رو می دیدم که تا نصفه و حتی پائین برف بود و یا حتی گرین های کوچیک تر مثل گیان ( گیاو ) گنبد کبود ( گمه کاو ) فارسبان ( فارسبو ) که کمتر و حدود 5 ماه تا نیمه برف دارند خوب دیگه باید عادت کنم وقت هم نمی شه برم نهاوند همیشه از این سبک زندگی که مجبور به قبول محدودیت های اطرافه متنفر بودم خوب شاید هفته دیگه بزنه سرم برم نهاوند . باز تهران بهتره لااقل تهران یه توچال داره اینجا کوههای برفدارش خیلی دورند
این رودخونه ایه که به بند گلستان میریزه اما اسمش رو نمیدونم:خجالت2: احتمالا امیرمحسن اسمش رو میدونه
این عکس هم احتمالا از سمت بند گلستان گرفته شده
Amir Mohsen
متخصص بخش هواشناسی
Cold Front - Meteorological Physical Background
Fronts generally form within a baroclinic boundary between cold and warm air masses. The main physical process for the development of Cold Fronts is the movement of the cold air against warm air. The warm air ascends along the boundary while the cold air sinks below it. If there is enough humidity, the upward motion leads to condensation and to the development of clouds and precipitation. Cold Fronts can be devided into two types: Ana and Kata Cold Fronts. These types can be described both in terms of classical frontal theory and in terms of conveyor belts.
The main feature which separates the different types of Cold Front is the orientation of the jet relative to the front in the middle and upper levels of the troposphere:
[h=2]Discussion In the literature, as well in the studies carried out by ZAMG and FMI, there are some uncertainties about the structure of Ana and Kata types:
[h=2]Ana Cold Front According to the classical theory:
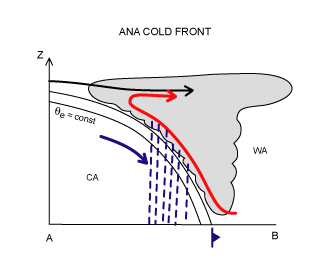
According to the conveyor belt theory:
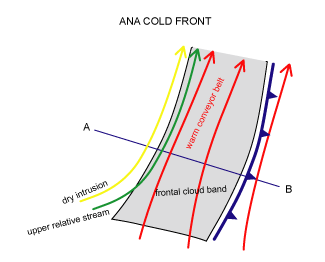
The 308K isentropic surface is close to the upper boundary of the frontal zone reaching through the whole troposphere. The frontal cloudiness is under the influence of the Warm Conveyor Belt.
[h=2]Kata Cold Front According to classical theory:
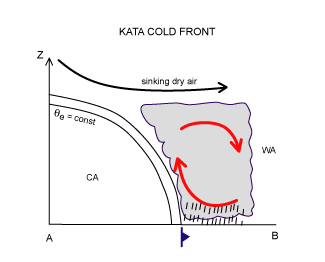
According to the conveyor belt theory:
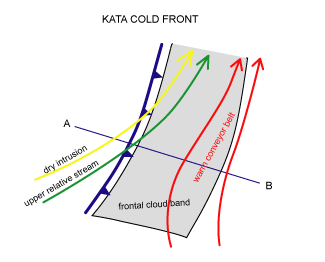
The 312K isentropic surface is close to the upper boundary of the frontal zone. The relative streams show that most parts of the frontal cloud band are under the influence of the moist upper relative stream coming from behind. The Warm Conveyor Belt is only associated with some cloudiness in the leading edge of the cloud band. There are a lot of similarities between Kata Cold Fronts and Split Fronts (see Split Front ). The main difference is the orientation between the jet and the front.
It is generally considered that a Kata Cold Front evolves from an Ana Cold Front. As baroclinic disturbances often develop over the Atlantic, the newly developed Ana Fronts can mainly be found there, whereas older, continental fronts are mostly Kata type. Another reason for the spatial differences might be that the lower parts of the front are decelerated due to the friction of the continent, while the upper parts continue with higher speed.
by ZAMG and FMI
Fronts generally form within a baroclinic boundary between cold and warm air masses. The main physical process for the development of Cold Fronts is the movement of the cold air against warm air. The warm air ascends along the boundary while the cold air sinks below it. If there is enough humidity, the upward motion leads to condensation and to the development of clouds and precipitation. Cold Fronts can be devided into two types: Ana and Kata Cold Fronts. These types can be described both in terms of classical frontal theory and in terms of conveyor belts.
The main feature which separates the different types of Cold Front is the orientation of the jet relative to the front in the middle and upper levels of the troposphere:
- In the case of an Ana Cold Front, the jet axis and dry intrusion are parallel to the frontal cloud band, and form a well pronounced rear cloud edge.
- In the case of a Kata cold front, the jet axis crosses the frontal cloud band.
[h=2]Discussion In the literature, as well in the studies carried out by ZAMG and FMI, there are some uncertainties about the structure of Ana and Kata types:
- It is not always completely clear whether a Cold Front is Ana or Kata type.
- Even within the same front Ana and Kata structures can be observed; in these cases Ana features can be found close to the occlusion point, whereas Kata structures prevail in the parts of the front farther away.
- The frontal cloudiness, especially in Kata Cold Front, is often not produced solely by the Warm Conveyor Belt. The rear parts of the cloud band are produced by an upper relative stream orginating from the trough behind the Cold Front. This moist rising stream can sometimes be followed backwards as far as the area of Warm Front clouds. Thus, the upper relative stream is added to the schematics describing the conveyor belt model of the Ana and Kata Fronts.
- There can be parallel or even forward inclined Warm Conveyor Belts. The rearward component at lower levels is due to the ageostrophic wind within the boundary layer, while the parallel or even forward sloping Warm Conveyor Belt in the middle and upper levels is in accordance with the geostrophic wind relationship.
[h=2]Ana Cold Front According to the classical theory:
- The cold air moves rapidly against warm air, creating convergence within the baroclinic zone between the two air masses.
- Convergence forces the warm, moist air to ascend along the frontal surface. The developing cloud band is inclined rearward with height.
- The main zone of cloudiness and precipitation is located behind the surface front.
- An exception is a case with strong upper winds which force the high clouds to extend downstream ahead of the surface front.

According to the conveyor belt theory:
- The frontal cloud band and precipitation are related to an ascending Warm Conveyor Belt, which has a rearward component relative to the movement of the front, causing the frontal cloud band and precipitation to appear behind the surface front.
- Parallel to the warm conveyor belt there is a dry stream (dry intrusion). The sharp rear cloud edge of frontal cloudiness marks the transition between the two relative streams.

| 04 October 2005/12.00 UTC - Vertical cross section; black: isentropes, blue: relative humidity, orange thin: IR pixel values, orange thick: WV pixel values | 04 October 2005/12.00 UTC - Meteosat 8 IR 10.8 image; magenta: relative streams 308K - system velocity 236° 15 m/s, yellow: isobars 308K; position of vertical cross section indicated |
|
|
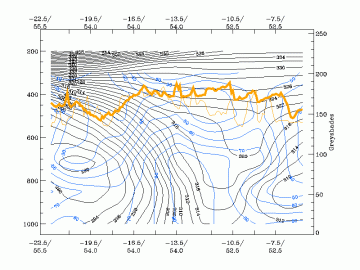
The 308K isentropic surface is close to the upper boundary of the frontal zone reaching through the whole troposphere. The frontal cloudiness is under the influence of the Warm Conveyor Belt.
[h=2]Kata Cold Front According to classical theory:
- The ascent of warm air is restricted by dry descending air originating from behind the front and, consequently, dissipating the higher clouds.
- The main zones of cloudiness and precipitation appear in front of the surface front.

According to the conveyor belt theory:
- The ascending Warm Conveyor Belt is overrun by the dry intrusion.
- The dry air originates from upper levels of the troposphere or even from the lower levels of the stratosphere, and crosses the Cold Front from behind.
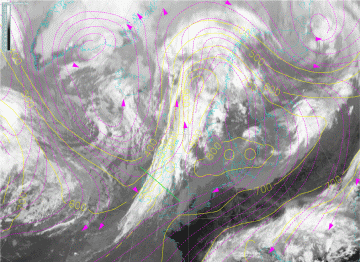
- The warm conveyor belt acquires a component which is inclined forwards relative to the movement of the Cold Front. Therefore, frontal clouds and precipitation tend to lie ahead of the surface front.
- The cloud tops in the area of the dry airstream are relatively low, whereas on the leading edge of this area the cloud tops are higher. This area indicates the so-called upper Cold Front.
- The air mass which is advected by the dry intrusion is colder than the air within the warm conveyor belt. The intrusion cools air above and, later, also ahead of the Cold Front. Furthermore, the air of the upper relative stream has lower equivalent potential temperature. The result is the development of a conditionally unstable layer close to the leading edge of the frontal cloud band. This can be observed as a transformation of layered clouds into convective ones.

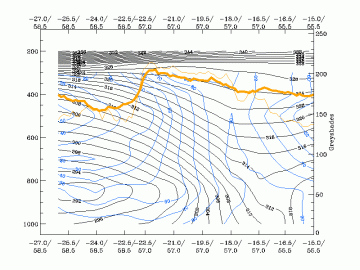
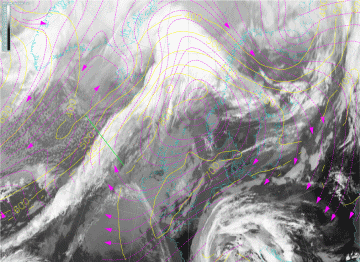
| 19 September 2005/12.00 UTC - Vertical cross section; black: isentropes, blue: relative humidity, orange thin: IR pixel values, orange thick: WV pixel values | 19 September 2005/12.00 UTC - Meteosat 8 IR 10.8 image; magenta: relative streams 312K - system velocity 236° 15 m/s, yellow: isobars 312K; position of vertical cross section indicated |
|
|
The 312K isentropic surface is close to the upper boundary of the frontal zone. The relative streams show that most parts of the frontal cloud band are under the influence of the moist upper relative stream coming from behind. The Warm Conveyor Belt is only associated with some cloudiness in the leading edge of the cloud band. There are a lot of similarities between Kata Cold Fronts and Split Fronts (see Split Front ). The main difference is the orientation between the jet and the front.
It is generally considered that a Kata Cold Front evolves from an Ana Cold Front. As baroclinic disturbances often develop over the Atlantic, the newly developed Ana Fronts can mainly be found there, whereas older, continental fronts are mostly Kata type. Another reason for the spatial differences might be that the lower parts of the front are decelerated due to the friction of the continent, while the upper parts continue with higher speed.
- وضعیت
- موضوع بسته شده است.


