[h=3]CHARACTERISTICS OF AIR PARCELS AND AIR MASSES; CLOUDS
[FONT=Arial, Helvetica, sans-serif]Note: A helpful summary of air parcel behavior can be found at this
University of Georgia web site.
[FONT=Arial, Helvetica, sans-serif] [FONT=Arial, Helvetica, sans-serif]We have now examined the roles of temperature and pressure in determining many of the aspects of the Earth's weather and climates. We will now explore how such factors as T and P variations, together with changes in water content of the atmosphere, movements of the oceanic currents, and the rotation of the Earth itself go about producing daily weather at our home locations and everywhere and also determine aspects of the varieties of climates found over the globe. One fact will become obvious: Although the atmosphere's composition remains nearly constant both spatially and temporarily, the air itself in the troposphere is subject to small to large variability in the factors stated above. This provides the driving forces that lead to the general characteristics of weather and climate.
[FONT=Arial, Helvetica, sans-serif] [FONT=Arial, Helvetica, sans-serif]Local, relatively small volumes of air within the boundary layer whose behavior we choose to investigate are termed
air parcels. Much larger volumes of air (at least 1600 km [1000 miles] in horizontal dimensions) that can move considerable distances within the troposphere are called
air masses; these are characterized by these features.
[FONT=Arial, Helvetica, sans-serif]
Air Masses
� Large regions in which properties of air have small horizontal variation
�Generally form over extensive surfaces with light winds � source regions
� Boundaries separating air masses are called fronts
[FONT=Arial, Helvetica, sans-serif]Any given air parcel or air mass shows relative uniformity (homogeneity) in its defining characteristics (general temperature range, pressures, moisture content, etc.). There are different air masses (properties of one fall within a specific range in contrast to others elsewhere in the atmosphere) that are usually in motion following definite paths through the troposphere with respect to others existing at the time located adjacent to a specific air mass. These establish the weather systems acting at any particular time.
[FONT=Arial, Helvetica, sans-serif] [FONT=Arial, Helvetica, sans-serif]The atmosphere is made up of a number of species of elements and compounds. Each contributes to the total atmospheric pressure (each has a
partial pressure). The behavior of gases from the viewpoint of physics involves principles of thermodynamics. Fundamental to this is the first law of thermodynamics, as expressed here:
[FONT=Arial, Helvetica, sans-serif]
[FONT=Arial, Helvetica, sans-serif]This can be stated in this simple formula: Q = T + W. The internal energy (heat content) Q of an air parcel subject to movement within the atmosphere may be changed, either by a change in temperature or by doing work on its surroundings. When the parcel rises, its density decreases as the parcel expands (does work on its surroundings); conversely, a downward moving parcel is compressed (increases its density) and warmed. (Expansion reduces pressure; contraction increases P.) (One way to look at this: less dense gas has its particles further apart, so the number exerting impacts per unit area decreases [lowering pressure]; contraction pushes particles closer so as to increase impacts (raising pressure].) If the change in density is
adiabatic (no energy added or removed, i.e., Q = 0; if there is heat exchange one outcome could be a constant temperature - the isothermal case), then expansion is accompanied by cooling (W is +; T is -) whereas contraction (compression) involves warming (W is -; T is +). This is a fundamental property of the thermodynamics of gases and is a key concept in dealing with air parcels and masses since the general response of rising or falling air is always adiabatic.
[FONT=Arial, Helvetica, sans-serif] [FONT=Arial, Helvetica, sans-serif]Now, in the real world of the atmosphere air in the boundary layer near the surface will be heated by solar insolation combined with a rise in ground or water surface temperatures. This heating causes parcels to expand and rise into the atmosphere (thermal convection; see below). As this rising air moves upwards it will lose heat to its surroundings and cool. The drop in temperature that results will follow some pattern called the
Lapse Rate. The Normal Lapse Rate in the troposphere is 6.5 °C.; this is also called the Environmental Lapse Rate (ELR). The cooling itself is adiabatic (no more heat enters or leaves). As long as the parcel is warmer than its surrounding air, it continues to rise. But if, as it continues to cool, it enters air that is less cool (i.e., warmer) it will start to sink or subside. In the examples that follow, it is assumed that an air parcel does not physically mix with its surroundings (no air exchanged across boundary between parcel and surroundings). In fact, winds, turbulence, and other factors do disturb the boundary region as some mixing occurs but not enough to compromise the parcel's thermodynamic behavior.
[FONT=Arial, Helvetica, sans-serif][FONT=Arial, Helvetica, sans-serif]In the general case exhibited in this diagram, the black line shows the typical temperature curve in the troposphere and part of the stratosphere. For a parcel having the same temperature as that for the normal ELR (T [SUB]e[/SUB] = 10°C), at that altitude (height), the parcel will be stable and stationary. If the temperature T[SUB]p[/SUB] of the parcel is, say,- 10°C, the air will sink; if greater than Y[SUB]e[/SUB], say, 30°C, the air will rise.
[FONT=Arial, Helvetica, sans-serif][FONT=Arial, Helvetica, sans-serif]
[FONT=Arial, Helvetica, sans-serif][FONT=Arial, Helvetica, sans-serif] [FONT=Arial, Helvetica, sans-serif]The next three diagrams further explore this concept:
[FONT=Arial, Helvetica, sans-serif]
[FONT=Arial, Helvetica, sans-serif]The above diagram simply shows the expansion of the parcel as it moves upwards from the surface (1000 mb pressure) to an altitude where the pressure of the surrounding air is at 500 mb.
[FONT=Arial, Helvetica, sans-serif] [FONT=Arial, Helvetica, sans-serif]In the next pair of diagrams, the top shows how the parcel expands and cools as it reaches an altitude where its internal pressure (700 mb) equals that of the surrounding air pressure, at which height it would cease to rise further. In the bottom situation, the parcel has moved into air whose pressure is < 700 mb (not properly labeled as such in this diagram) so that it is now denser and begins to sink, warming as it falls.
[FONT=Arial, Helvetica, sans-serif]
The lifting or rising of an air mass can be accomplished in any of 4 ways:
1.
Thermal Convection: from surface or lower atmosphere heating.
2.
Dynamic Convergence: winds coming together force air to concentrate, squeezing it and causing it to move upwards.
3.
Frontal Collision: two different air masses, one colder than the other, meet, causing the cold air to wedge under the warm air and driving the latter upward.
4.
Orographic Uplift: Air moving laterally meets mountains or other features that form topographic barriers, causing the air to rise to get past.
[FONT=Arial, Helvetica, sans-serif]For now, we will concentrate on thermal convection; the other three causes of uplift will be described later. Look first at this diagram that illustrates convective uplift.
[FONT=Arial, Helvetica, sans-serif]
[FONT=Arial, Helvetica, sans-serif]The next four diagrams introduce the concepts of Air Stability and Instability, and Dry and Moist Adiabatic Lapse Rates.
[FONT=Arial, Helvetica, sans-serif]
[FONT=Arial, Helvetica, sans-serif]Stable air experiences relatively less changes in temperature with height, and consequently less tendency to move rapidly up or down to new positions. Unstable air, resulting from considerable surface heating, moves the air up rapidly with notable cooling enroute.
[FONT=Arial, Helvetica, sans-serif] [FONT=Arial, Helvetica, sans-serif]If the air has a low moisture content for its temperature, i.e., is unsaturated (does not contain all the moisture it can hold at the prevailing temperature
), its temperature decrease as it rises (moves upwards) is determined by its Dry Adiabatic Lapse Rate (DALR). A typical value is -10°C per kilometer upwards into the atmosphere. If, instead, the air is saturated, the Moist Adiabatic Lapse Rate (MLR) applies. A typical value may be - 6°C per km of rise. The general relationship between DALR and MLR is shown here and comments about the two parameters appear beneath the plots.:
[FONT=Arial, Helvetica, sans-serif] [FONT=Arial, Helvetica, sans-serif]We can improve our understanding by taking a pair of examples with actual numbers. In the left diagram below T[SUB]d[/SUB] denotes the ELR temperature. Here it is 0°C. Air initially at T = 20° rising under dry adiabatic conditions will cool at 1 km to T = 10°C but at that altitude the ELR temperature has changed to 2°C, so the air will keep rising. On the right diagram, the starting condition for the air has an ELR T[SUB]d[/SUB] of 20°C and the air parcel itself has T = 20°C. As the air parcel is forced up, it cools but at a lower rate because condensation releases latent heat. When it reaches 1 km, T = T[SUB]d[/SUB] and the moisture laden air ceases further rising.
[FONT=Arial, Helvetica, sans-serif]
[FONT=Arial, Helvetica, sans-serif] [FONT=Arial, Helvetica, sans-serif]Relative stability can also be expressed by comparing the Dry Lapse rates to the Actual Lapse Rate (although the simpler straight line ELR is used in the examples below).
[FONT=Arial, Helvetica, sans-serif] [FONT=Arial, Helvetica, sans-serif]Note that the Dry Adiabatic Lapse Rate tends to increase at a constant rate compared with the Moist Lapse Rate which varies with altitude.
[FONT=Arial, Helvetica, sans-serif] [FONT=Arial, Helvetica, sans-serif]In the next few paragraphs as we will expand on what happens to air parcels upon lifting in terms of their degree of stability.
[FONT=Arial, Helvetica, sans-serif] [FONT=Arial, Helvetica, sans-serif]Lets expand upon these ideas with a related set of diagrams.
[FONT=Arial, Helvetica, sans-serif] [FONT=Arial, Helvetica, sans-serif]A Stable Atmosphere is one that strongly resists change. It occurs whenever the Dry Adiabatic Lapse Rate is greater (and thus cools more with height) than the Environmental Lapse Rate. Air parcels under this condition that are forced upwards cool rapidly (quickly becoming colder than its surroundings) and act as though they have negative buoyancy, i.e., they overcome the lifting force and tend to sink at some stage to restore equilibrium. Stable air is clear (blue skies) and devoid of stormy conditions.
[FONT=Arial, Helvetica, sans-serif] [FONT=Arial, Helvetica, sans-serif]In a Neutral Atmosphere, the Dry and Environmental (Actual) Lapse Rates are the same and the temperatures of both the parcel and its surrounding air are identical at some neutral layer (which can have a notable vertical thickness, within which the parcel and surrounding air are in thermal equilibrium [same temperatures]). A parcel will rise and cool until it reaches this layer where the temperature balance occurs. This situation usually occurs through some external lifting force or condition such as convergence or orographic rise.
[FONT=Arial, Helvetica, sans-serif][FONT=Arial, Helvetica, sans-serif]An Unstable Atmosphere is marked by the DALR being less than the ELR. A rising parcel remains warmer than its surrounding air and has positive bouyancy (tends to keep rising). It needs little external force conditions to commence rising. It will continue to rise until, as it cools, it attains thermal equilibrium with its surroundings.
[FONT=Arial, Helvetica, sans-serif][FONT=Arial, Helvetica, sans-serif] [FONT=Arial, Helvetica, sans-serif]An unstable air parcel will behave differently when the amount of moisture it contains is sufficient to bring the Moist Lapse Rate into play. Consider this figure. (The term LCL stands for Lifting Condensation Level, an altitude determined by some pressure at which any moisture in the parcel experiences temperature-controlled saturation and begins to condense).
[FONT=Arial, Helvetica, sans-serif] [FONT=Arial, Helvetica, sans-serif]In the above diagram, the moist air parcel is initially 7°C at the surface. It is initially unsaturated and cools according to the dry adiabatic lapse rate. At the LCL it is saturated and cools according to the moist adiabatic lapse rate. The diagram shows that the parcel is warmer than the surrounding air both above and below the LCL; thus, the entire layer illustrated by this diagram is categorized as unstable. As we have pointed out, in an unstable layer, the initial lifting force is only needed to get to the parcel going upwards. Immediately after the lifting begins, the parcel is buoyant and convection will continue on its own. Unstable environments are common in the afternoons during the summer and are often responsible for producing late afternoon thunderstorms. A typical set of conditions is depicted in this diagram.
[FONT=Arial, Helvetica, sans-serif] [FONT=Arial, Helvetica, sans-serif]This next pair reiterates some of the above ideas but puts typical lapse rate values into the plots. The straight line nature of the plots is often alluded to as Absolute Stability and Absolute Instability. The plots appear again in the two diagrams below the pair in which the conditions are displayed pictorially. In the diagrams, Γ or Gamma refers to the adiabatic lapse rates that are further defined by the subscripts e = environmental, d = dry, and m = moist.
[FONT=Arial, Helvetica, sans-serif] [FONT=Arial, Helvetica, sans-serif]The conditions for Absolute Instability occur usually in the lower atmosphere on warm days. More commonly, the conditions favor Conditional Instability. The rising air has a lapse rate between the local DALR and MLR. The air initially rises as stable. Upon reaching the LCL, this air becomes relatively warmer than surrounding air and will continue to rise without any outside forces (self buoyant). This situation is especially associated with orographic effects. These diagrams show this instability variant.
[FONT=Arial, Helvetica, sans-serif] [FONT=Arial, Helvetica, sans-serif]Another condition that affects air parcels in Inversion. This occurs when condition reverse the lapse rate so that instead of continually falling temperatures a layer is reached in which the temperatures actually rise. This can happen naturally when a warm air mass rides over a cold (as described later) or when special conditions associated with pollution are made. Diagrammatically, inversion appears thusly.
[FONT=Arial, Helvetica, sans-serif] [FONT=Arial, Helvetica, sans-serif]Los Angeles is notorious for its smog layers. The combination of hot air coming from the desert, off the mountains and into the Los Angeles Basin that is then underridden by cool air off the ocean produces this common condition;
[FONT=Arial, Helvetica, sans-serif] [FONT=Arial, Helvetica, sans-serif]Let's apply some of the above ideas to a real case atmosphere. In such an atmosphere different layers have different stability responses. First look at this table defining the three prime modes of stability
[FONT=Arial, Helvetica, sans-serif] Γ[SUB]e[/SUB] < Γ[SUB]m[/SUB] < Γ[SUB]d[/SUB]= Absolutely stable
Γ[SUB]m[/SUB] < Γ[SUB]e[/SUB] < Γ[SUB]d[/SUB] = Conditional Instability
Γ[SUB]m[/SUB] < Γ[SUB]d[/SUB] < Γ[SUB]e[/SUB] = Absolutely unstable
-------------------------------
The symbol Γ (Gamma) refers to adiabatic lapse rate; d = dry; m = moist; e = environmental
[FONT=Arial, Helvetica, sans-serif]The real case is show in terms of straight line lapse rates that shift their slopes at different altitudes. When the appropriate calculations are done (not shown here), the layers involved show these stability modes: 1) absolute instability; 2) conditional instability; 3) absolute stability; 5) conditional instability; 5) absolute stability; 6) absolute stability.
[FONT=Arial, Helvetica, sans-serif] [FONT=Arial, Helvetica, sans-serif]We are now ready to shift attention to Air Masses. In one sense, an air mass can be thought of as a huge air parcel. Once formed it tends to move laterally through the troposphere (often confined mainly to thick boundary layers) where it meets and interacts with other air masses it may encounter. An individual air mass (remember, at least 1600 km wide to qualify as one) will show more internal variability than the small air parcel but is characterized by sets of T, P, and moisture conditions that are fairly homogeneous in toto but with discrete changes of these conditions with altitude and fluctuations from place to place within the mass.
[FONT=Arial, Helvetica, sans-serif] [FONT=Arial, Helvetica, sans-serif]The air masses can be grouped into five major types based on combinations of two sets of parameters: 1) cold, cool, warm; and 2) dry and moist. The figure and table below show these combinations and provide indications of their major characteristics.
[FONT=Arial, Helvetica, sans-serif] [FONT=Arial, Helvetica, sans-serif]They are further classified in terms of broad geographic places of origin, set up in these two groupings: 1) Arctic; Polar; Tropic (from high to low latitudes - rotational pole to equator); and 2) Maritime and Continental (oceans and large land masses).
[FONT=Arial, Helvetica, sans-serif] [FONT=Arial, Helvetica, sans-serif]The general starting point regions and directions of movement of the major air masses onto the North American continent are depicted in this geographic diagram:
[FONT=Arial, Helvetica, sans-serif] [FONT=Arial, Helvetica, sans-serif]The next map shows air mass distribution at a global scale. While the plotted positions are typical, their locations are generalized, so that any of the five types can begin in different regions (but controlled by the latitudinal and land/water locations described above) and more than the number shown may exist at any one time.
[FONT=Arial, Helvetica, sans-serif] [FONT=Arial, Helvetica, sans-serif]Within an air mass there will usually be clouds present (can be few in number in a cold, dry air mass or can be predominant [almost everywhere] in a moist, warm air mass). Clouds represent condensed forms of water (mainly coarse to fine droplets; but also very fine mist; ice particles, hail pellets. snowflakes) that may have finite boundaries as seen from a point locale or may seem to extend beyond the horizon.
[FONT=Arial, Helvetica, sans-serif] [FONT=Arial, Helvetica, sans-serif]There are four main ways in which clouds form through condensation mechanisms involving uplift of moist air, as shown in this diagram:
[FONT=Arial, Helvetica, sans-serif] [FONT=Arial, Helvetica, sans-serif]Cloud classifications go back to ancient times but the first modern one was presented by the Englishman Luke Howard in 1802. Variants of this has since emerged but the basic factors in classifying clouds remain their heights (several different ranges), their modes of origin, their appearance, and their relation to modes of precipitation. Nomenclature is taken from Latin words. All this is summarized in this chart.
[FONT=Arial, Helvetica, sans-serif] [FONT=Arial, Helvetica, sans-serif]This next diagram (split to appear in top/bottom format) is a pictorial representations of the different cloud types listed in the table.
[FONT=Arial, Helvetica, sans-serif] From Lutgens and Tarbuck, 1992; adapted from a Ward's Natural Science Establishment illustration.
[MENTION=26376]pokerface[/MENTION]
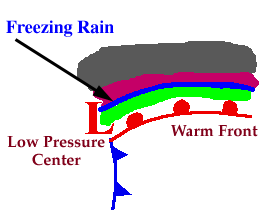 The diagram below shows a typical temperature profile for freezing rain with the red line indicating the atmosphere's temperature at any given altitude. The vertical line in the center of the diagram is the freezing line. Temperatures to the left of this line are below freezing, while temperatures to the right are above freezing.
 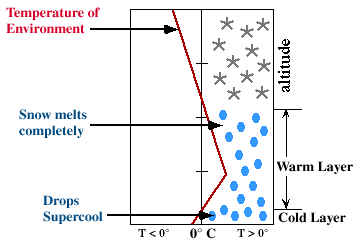 Freezing rain develops as falling snow encounters a layer of warm air deep enough for the snow to completely melt and become rain. As the rain continues to fall, it passes through a thin layer of cold air just above the surface and cools to a temperature below freezing. However, the drops themselves do not freeze, a phenomena called supercooling (or forming "supercooled drops"). When the supercooled drops strike the frozen ground (power lines, or tree branches), they instantly freeze, forming a thin film of ice, hence freezing rain.


