• توجه: در صورتی که از کاربران قدیمی ایران انجمن هستید و امکان ورود به سایت را ندارید، میتوانید با آیدی altin_admin@ در تلگرام تماس حاصل نمایید.

مباحث عمومی هواشناسی

وضعیت
موضوع بسته شده است.

هادی...

New member


بهر حال مدلهای هواشناسی هم بارش مطلوبی رو برای رشت نشون میدن وهم سرمای خوبی:


با توجه به صحبت های شما و علیرضا حساسیت بارش برف در رشت برای من فرقی با مشهد نداره و پیگیر این موضوع میشم.

چنانچه در آپدیتهای جدید نقشه ها ، بارش برف در رشت منتفی بشه حتما در این زمینه اطلاع رسانی لازم رو انجام میدم

کانتر 534 کانتری نیست که بتونه دررشت برفی ببارونه که سفید بکنه

بازامیدوارم سرما تقویت وبارش برف روداشته باشیم
 

ali.doosti

کاربر ويژه
امیرجان لطف می کنید یه نقشه از مسیر نفوذ پرفشار مهاجر که ظهر بررسی کردین بذارید؟ برای تاریخ 8 و 9 دسامبر می خواستم:گل:
 

Amir Mohsen

متخصص بخش هواشناسی
Evidence Shows Global Heat May Be Hiding in Oceans
  • Published: November 30th, 2013


By Tim Radford, Climate News Network
LONDON – Far below the surface, the waters of south-east Asia are heating up. A region of the Pacific is now warming at least 15 times faster than at any time in the last 10,000 years. If this finding – so far limited to the depths where the Pacific and Indian Oceans wash into each other – is true for the blue planet as a whole, then the questions of climate change take on a new urgency.
assets-climatecentral-org-images-uploads-features-11-26-13_MW_ocean-heat-500x307.jpg
Report shows that deep ocean warming could right now be taking much of the heat that meteorologists had expected to find in the atmosphere.
Credit: Sathish J/Flickr
Yair Rosenthal of Rutgers University in New Brunswick and colleagues from the Lamont-Doherty Earth Observatory at Columbia University in New York, and at the Woods Hole Oceanographic Institution in Massachusetts, report in the journal Science that deep ocean warming could right now be taking much of the heat that meteorologists had expected to find in the atmosphere.
In the last few years, even though greenhouse gas levels in the atmosphere have gone up, the rate of increase in global average temperatures has slowed and there is evidence that much of the expected heat is being absorbed by the oceans and carried beneath the surface.
[h=3]Record in shells But records of ocean temperatures are patchy, and in any case date back only half a century. Rosenthal and his colleagues decided that they could reliably calculate a pattern of temperature changes by looking at a record of deposition through time.
One little single-celled organism called Hyalinea balthica has evolved to live only at depths of 500 to 1,000 metres. H.balthica makes a microscopic shell, and when it dies, this shell falls to the ocean bottom. It takes the ingredients for the shell from the elements dissolved in the water around it, and the chemical mix available varies with temperature: the warmer the water, the greater the ratio of magnesium to calcium – and this difference is then recorded in the surviving shell.
So the marine sediments around Indonesia preserve a thermal record of changes with time. The scientists studied ocean cores to “read” a pattern of climate change over the last 10,000 years, since the end of the Ice Age. The readings from the sediments mirror a series of already-known climate shifts – a very warm spell at the end of the Ice Age, a “medieval warm period” when vineyards flourished in Britain, and a “Little Ice Age” when rivers like the Thames of London routinely froze.
So equipped with a reliable guide to change the scientists were able to make sense of the changes in the last 60 years. And they found that ocean temperatures, at such depths, had warmed 15 times faster in the last 60 years that they did during the natural warming cycles of the last 10,000.
assets-climatecentral-org-images-uploads-news-11-26-13_CNN_oceanheat-500x300.jpg
View of the Pacific Ocean from Space. A region of the Pacific is now warming at least 15 times faster than at any time in the past 10,000 years.
Credit: NASA via Climate News Network
The research is incomplete, and its chief value may be in helping to improve the models used by climate scientists. But the implication is that the heat that should be registered in the atmosphere is now being absorbed by the deep oceans.
[h=3]No cause for complacency This does not mean that climate scientists can stop worrying about global warming. “We may have underestimated the efficiency of the oceans as a storehouse for heat and energy,” Rosenthal said. “It may buy us some time – how much time I don’t really know – to come to terms with climate change. But it’s not going to stop climate change.”
His colleague Braddock Linsley of Lamont-Doherty said: “Our work showed that the intermediate waters in the Pacific had been cooling steadily from about 10,000 years ago. This places the recent warming of the Pacific intermediate waters in temporal context. The trend has now reversed in a big way and the deep ocean is warming.”
Tim Radford is a reporter for Climate News Network. Climate News Network is a news service led by four veteran British environmental reporters and broadcasters. It delivers news and commentary about climate change for free to media outlets worldwide.
 

Amir Mohsen

متخصص بخش هواشناسی
[h=2]Why did Earth’s surface temperature stop rising in the past decade?


Friday, November 8, 2013


The most likely explanation for the lack of significant warming at the Earth’s surface in the past decade or so is that natural climate cycles—a series of La Niña events and a negative phase of the lesser-known Pacific Decadal Oscillation—caused shifts in ocean circulation patterns that moved some excess heat into the deep ocean. Even so, recent years have been some of the warmest on record, and scientists expect temperatures will swing back up soon.
YearlySurfaceTempAnom1880-2010.jpg
Yearly surface temperatures since 1880 compared to the twentieth-century (1901-2000) average (dashed line at zero). Since 2000, temperatures have been warmer than average, but they did not increase significantly. Data courtesy of NOAA’s National Climatic Data Center.

The “pause” in global warming observed since 2000 followed a period of rapid acceleration in the late 20th century. Starting in the mid-1970s, global temperatures rose 0.5 °C over a period of 25 years. Since the turn of the century, however, the change in Earth’s global mean surface temperature has been close to zero. Yet despite the halt in acceleration, each of the last three decades has been successively warmer at the Earth’s surface than any preceding decade since 1850.
DecadelTempAnom1880-200.jpg
Surface temperature each decade since 1880 compard to the twentieth-century (1901-2000) average (dashed line at zero). Each of the last three decades was the warmest on record at the time, and each was warmer than the last. Data courtesy of NOAA’s National Climatic Data Center.

The long-term trend—change over the course of a century or more—is what defines “global warming,” not the change from year to year or even decade to decade. Rising emissions of carbon dioxide and other greenhouse gases since the Industrial Revolution explain most of the overall warming trend over the past century, and the rate of emissions has not slowed significantly in the recent past. So what else has been going on in the climate system over the past decade that could account for the pause in Earth’s surface warming trend?
During the last decade, a longer than usual solar minimum cycle, several volcanic eruptions, and relatively low amounts of water vapor in the stratosphere may have helped cool the atmosphere temporarily. But recent research suggests that the Earth’s natural climate variability—natural, short-term fluctuations in the climate system that occur on a year-to-year basis or longer—may have played the most pivotal role of all by transferring excess heat from the Earth’s surface into the deep ocean.
One of the most well-known natural climate oscillations—the El Niño-Southern Oscillation (ENSO) cycle—causes swings in sea surface temperatures in the tropical Pacific. Although ENSO originates in the equatorial Pacific Ocean, a strong El Niño or La Niña event is capable of bumping global temperatures upward or downward for a year or two. Since the last major El Niño event in 1997-1998, a series of La Niña events have dominated the tropical Pacific, resulting in a prolonged cooling of sea surface temperatures that has also likely stalled the rise in global temperatures.
OceanicNinoIndex1950-2010.jpg
Graph showing the Oceanic Niño Index (difference from average sea surface temperatures in a key region of the tropical Pacific Ocean) from 1980-2012. Cooling La Niña events (blue shading) in the past decade have outnumbered warming El Niño events (red shading). Data courtesy of the NOAA Climate Prediction Center.

Evidence for the global influence of these La Niñas comes from an innovative model experiment by a team of scientists from Scripps Institution of Oceanography. When they forced a climate model to closely follow observed temperatures in the tropical Pacific—mirroring the repeated La Niña events—the model simulated no significant trend in global warming since 2000. This led the group to believe that global temperatures would have continued to rise throughout the last decade if not for the prolonged cooling in the Pacific.
Just because the global surface temperature has not risen significantly in the past decade doesn't mean the Earth's heat energy imbalance has vanished, though. Excess heat energy trapped by greenhouses gases can have more than one fate in the Earth system; among other things, it can cause water to evaporate, it can melt ice, and it can be mixed into the deep ocean by overturning currents.
That mixing coupled with water's naturally large heat capacity makes the global ocean the Earth’s biggest absorber of heat; scientists estimate the ocean absorbs more than 90 percent of the excess heat trapped in the atmosphere by greenhouse gases. When analyzing temperature patterns at different depths of the ocean, scientists observed that deep ocean temperatures—measured more than a half-mile down from the surface—began to rise significantly around 2000, while shallower waters warmed more slowly. This divergence took place at the same time that a natural climate cycle called the Pacific Decadal Oscillation, or PDO, was shifting to a negative phase.
oceanprofile_tempBalmaseda1960-2008.jpg
Yearly global ocean heat content compared to the 1958-65 average (dashed line at zero) for the past four decades for different layers of the ocean: from the surface to depths of 300 meters (grey) and 700 meters (blue), and total depth down to 2,000 meters (purple). Surface waters warmed more slowly (line is nearly flat since the mid-2000s) than deeper waters (steep increase). Image adapted from Figure 1 of Balmaseda et al., 2013 (pdf).

Unlike the ENSO cycle, which affects the climate on a year-to-year basis, the PDO affects the climate on decadal timescales. Since the late 1990s, the negative phase of the PDO cycle has contributed to cooler sea temperatures at the surface of the tropical (similar to La Niña) and northeastern Pacific. Strong prevailing winds during the negative phase of the PDO also stir up the ocean and mix surface waters down into the deep ocean, allowing heat to penetrate to greater depths.
The deep ocean may have been able to "hide" excess heat trapped in the Earth system by greenhouse gases, contributing to the warming “pause” in the last decade, but scientists know that heat energy doesn't just disappear. Eventually, natural ocean circulation may bring some of the extra heat stored in the deep ocean back to the surface, which can happen during an El Niño event, for example.
Meanwhile, other environmental indicators of climate change—melting ice in Greenland, the retreat of Arctic sea ice, global sea level rise—continue to send a clear signal that Earth is still warming. Over the coming century, human-caused warming will continue, with natural variability periodically speeding up or slowing down the pace from decade to decade.
 

محمد بجنورد

کاربر ويژه
درود بر دوستان عزیز

به داش محسن گل تبریک میگم مجددا...:گل:،بارش نسبتا خوبی داشتیم..خدارو شاکریم از این بابت..:گل:

خب چه خبر؟؟آبدیت ها چطور شدن؟؟آخه از 7 صبح ک رفتم بیرون نیم ساعت پیش رسیدم خونه..برفمون هنوز پابرجاست؟؟اگه مشهد برفش بیشتره بگین بیام مشهد...
 

Amir Mohsen

متخصص بخش هواشناسی
[SIZE=+1] High and Low Pressure Centers
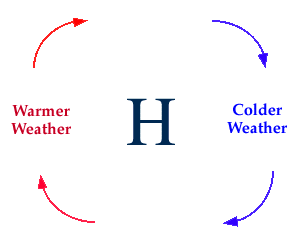
on forecasted temperatures The positions of high and low pressure centers can greatly influence a forecast. Fair weather generally accompanies a high pressure center and winds flow clockwise around a high. This means that winds on the back (western) side of the high are generally from a southerly direction and typically mean warmer temperatures. On the front (eastern) side of a high, winds are generally from the north and this typically results in colder temperatures.
hl1.gif


Forecast Tip:
If a city is expected to be located west of a high pressure center then warmer temperatures are likely. However, if the city is expected to be in the northerly winds of a high pressure center, then forecast colder temperatures. Cities under the influence of high pressure centers can expect generally fair weather with little or no precipitation.
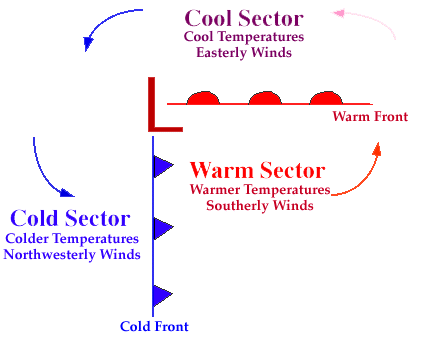
In contrast, clouds and precipitation generally accompany a low pressure center and winds flow counterclockwise around lows. This means that winds on the back (western) side of the low are generally from a northerly direction and typically mean colder temperatures. On the front (eastern) side of a low, winds are generally from the south and this typically results in warmer temperatures.
hl2.gif

Forecast Tip:
If a city is expected to be located west of a low pressure center then colder temperatures are likely. However, if the city is expected to be in the southerly winds of a high pressure center, then forecast warmer temperatures. Cities under the influence of low pressure centers can expect generally cloudy conditions with precipitation.
[/SIZE]
 

سیبری

کاربر ويژه
درود بر دوستان عزیز

به داش محسن گل تبریک میگم مجددا...:گل:،بارش نسبتا خوبی داشتیم..خدارو شاکریم از این بابت..:گل:

خب چه خبر؟؟آبدیت ها چطور شدن؟؟آخه از 7 صبح ک رفتم بیرون نیم ساعت پیش رسیدم خونه..برفمون هنوز پابرجاست؟؟اگه مشهد برفش بیشتره بگین بیام مشهد...

سلام داداشی فرقی نکرده چندان بارش و سرما سر جاشه
 

محمد بجنورد

کاربر ويژه
داش محسن سلام

خوبی؟؟شرمنده بعدازظهر جواب ندادم..سر کلاس بودم...:خجالت2::خجالت2:

آره داداش الان ک دیدم فرقی نکرده ولی اکیوودر از پیش بینی 5-10 سانت رسونده به 2-4 سانت!!!داستان همیشگی بجنورد و بازی درآوردن هاش امسال هم ادامه داره و ترک عادت نخواهد کرد مثل اینکه..:خنده1:
 

pokerface

متخصص هواشناسی
دوستان

بر اساس آخرین آپدیت مولفه اتمسفری MJO دیده میشه که این مولفه بزودی در فاز 2 که بنظر بهترین فاز موجود هست وارد میشه!

بذارید پس از وارد شدن این مولفه به فاز مذکور تحلیل جامعی ارائه خواهم داد و خواهید دید که علیرغم اینکه بعضی از اساتید تاکید زیادی بصورت کلاسیک بر شکل گیری پدیده های جوی بر اساس NAO و AO دارند ولی حقیقتا اقلیم منطقه ما چیز دیگری هست.

انسو و MJO در فصل بارشهای پاییزه و زمستانه ایران بزرگترین نقش رو ایفا میکنند، همانطوریکه در آنومالی بارشهای مطلوب اخیر در جنوب و جنوب غرب ایران این مطلب رو بوضوح دیدیم.


GFSO_phase_full.gif


همینجا داره یک گله دوستانه هم از استاد عزیز جناب پرنو داشته باشم:

علیرغم اینکه چندین بار بصورت خصوصی با ایشون تبادل لینک داشتم ولی در قسمت نظرات یکی از پستهای تحلیلی ایشون در خصوص یک نقشه اقلیمی از ایشون توضیحات خواستم و ازشون در خواست کردم که در یک پست مجزا به تحلیل نقشه مذکور بپردازند ولی متاسفانه نه تنها پست تحلیلی ارائه ندادند ، بلکه نظر من هم در وبللاکشون منعکس نشد.

باز هم میگم ایشون استاد ما هستند و علاقه بسیار به ایشون دارم و احترامشون واجبه ولی اگه به اینجا سر میزنند ، لطف کنند تا پاسخ نظر منو بدن.

از ایشون بسیار متشکرم:گل:

@pokerface

@DR WHO

@ali.doosti

@mehdi.

@
mostafa3053

از حسن نظر و نکته سنجی امیر محسن ممنونم.با نظرتون کاملا موافقم به نظر این بندهٔ حقیر ایران جزو خاور میانه‌ی شرقیست و رژیم بارشی بسیار متفاوت از ترکیه و قسمتهای غربیه مدیترانه دارد،با عنایت(واژهٔ جالبیه این عنایت و اکثر هواشناسا ازش استفاده می‌کنن!)به این موضوع بارشهای اکثر مناطق ایران به وجود رطوبت دریاهای جنوب(کم فشار‌های سودانی) و جابجأیی پر فشارهای شمالی مربوط هست و از این حیث برسی‌ شاخص‌های enso ، mjo و polar eurasia pattern (به عنوان بررسی جانمأی پر فشار‌های شمالی‌) بسیار مهمتر به نظر می‌رسد.در مرحلهٔ بعدی می‌توان به شاخص‌های ao و nao به عنوان شاخص‌های کمکی‌ نگاه کرد.
 

Amir Mohsen

متخصص بخش هواشناسی
[SIZE=+1] Cold Front
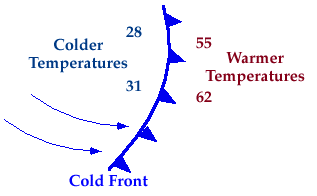
transition zone from warm air to cold air A cold front is defined as the transition zone where a cold air mass is replacing a warmer air mass. Cold fronts generally move from northwest to southeast. The air behind a cold front is noticeably colder and drier than the air ahead of it. When a cold front passes through, temperatures can drop more than 15 degrees within the first hour.

def1.gif
Symbolically, a cold front is represented by a solid line with triangles along the front pointing towards the warmer air and in the direction of movement. On colored weather maps, a cold front is drawn with a solid blue line.
[/SIZE]
 

Amir Mohsen

متخصص بخش هواشناسی
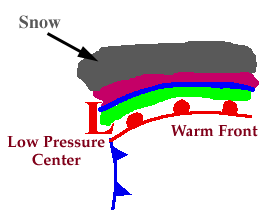
[SIZE=+1] Snow an aggregate of ice crystals Progressing even further away from the warm front, surface temperatures continue to decrease and the sleet changes over to snow.
snow1.gif
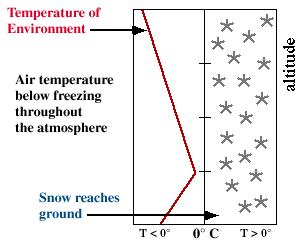
Snowflakes are simply aggregates of ice crystals that collect to each other as they fall toward the surface. The diagram below shows a typical temperature profile for snow with the red line indicating the atmosphere's temperature at any given altitude. The vertical line in the center of the diagram is the freezing line. Temperatures to the left of this line are below freezing, while temperatures to the right are above freezing.

snow2.gif
Since the snowflakes do not pass through a layer of air warm enough to cause them to melt, they remain in tact and reach the ground as snow.[/SIZE]
 
وضعیت
موضوع بسته شده است.
بالا