-
توجه: در صورتی که از کاربران قدیمی ایران انجمن هستید و امکان ورود به سایت را ندارید، میتوانید با آیدی altin_admin@ در تلگرام تماس حاصل نمایید.
You are using an out of date browser. It may not display this or other websites correctly.
You should upgrade or use an alternative browser.
You should upgrade or use an alternative browser.
مباحث عمومی هواشناسی
- شروع کننده موضوع Amir Mohsen
- تاریخ شروع
- وضعیت
- موضوع بسته شده است.
Amir Mohsen
متخصص بخش هواشناسی
Last time we discussed what severe weather is. We also discussed some aspects of where we find such phenomena within a thunderstorm.
[h=4]This Lesson Now that we know what severe weather is, we will discuss where severe weather comes from.
[h=4]What Causes Severe Weather? The vast majority of severe weather comes from thunderstorms. So, when we ask the question, "Where does severe weather come from?" what we are really asking is, "Where do thunderstorms come from?"
If we look at a thunderstorm,
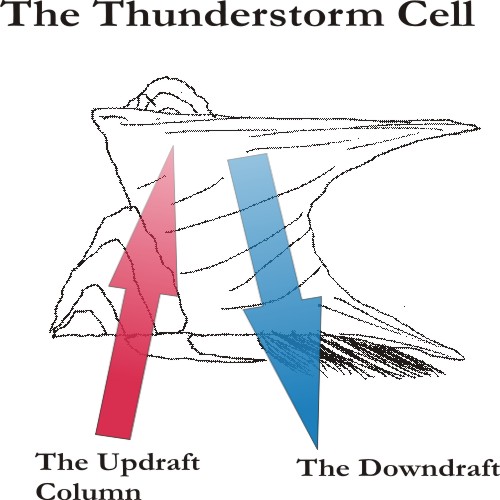
We will see that it is in two parts, the updraft and the downdraft. While this does not tell us where the thunderstorm comes from, it does give us a clue. Which comes first, the updraft, or the downdraft, or both? The updraft seems to be what starts the thunderstorm going. We will discuss the life-cycle of a thunderstorm in the next lesson. What we want to know here is what gets the air to begin rising
It turns out that there are several things that can get the air to rise:
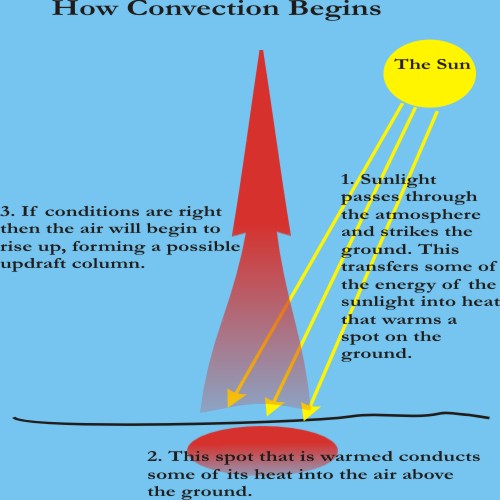
Convection
This is the most common notion of how air rises:
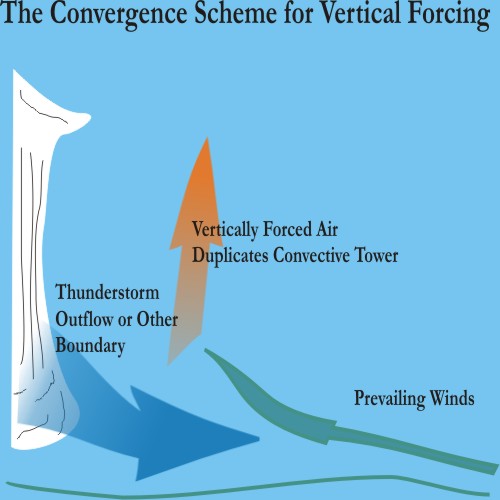
Convergence
This occurs when winds at the ground run into each other coming from different directions. The leading edge of these winds are called boundaries:
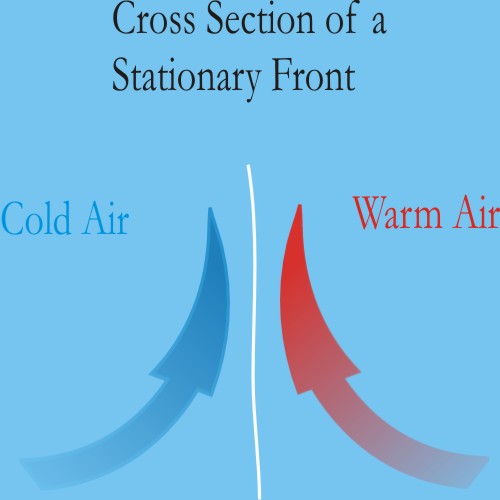
Fronts
We have all seen these on the weather maps. They represent the boundary between warm and cold air. These are often a focus of thunderstorm development. We will begin with a stationary front, here we have two air masses that sit next to each other. There is very little movement in the position of a stationary front.
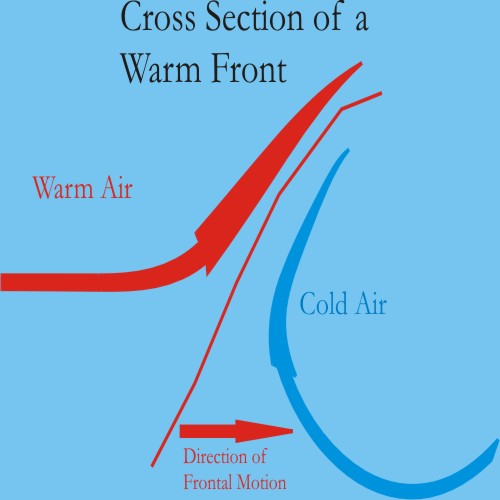
Next we have a warm front. Here warm air is pushing into and over cold air.
Here we have a cold front, where cold air is moving into an area of warm air, which is forced up and over the colder air at the surface.
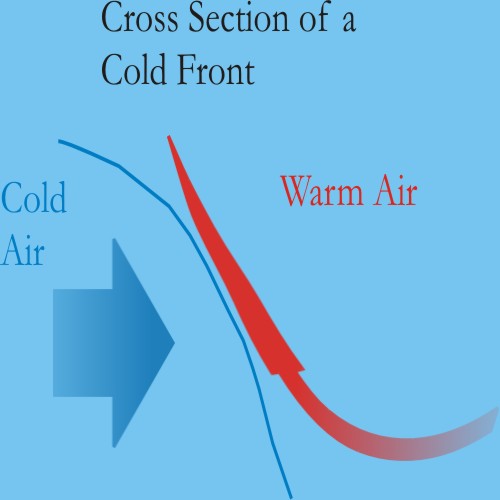
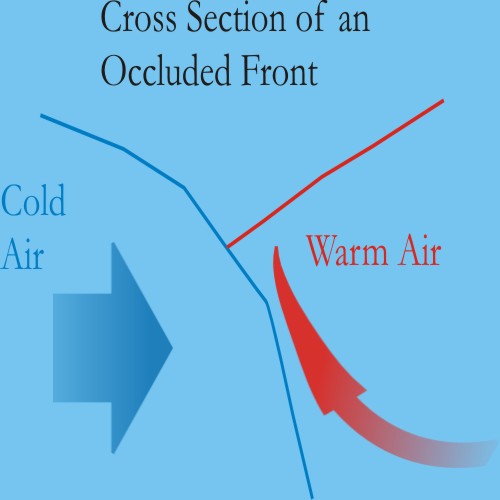
An occluded front occurs when a cold front catches up to a warm front. In the picture below we see that the warm front is actually being lifted up over the top of the cold front. The rising air at the leading edge of the warm front will be forced to rise even faster now. A similar situation can result if the cold front rises up and over the warm front.
There are two ways of finding a front on the map:
[*=left]Use an existing analysis map that draws the front using the symbols below.
[*=left]Use a surface map and draw your own.
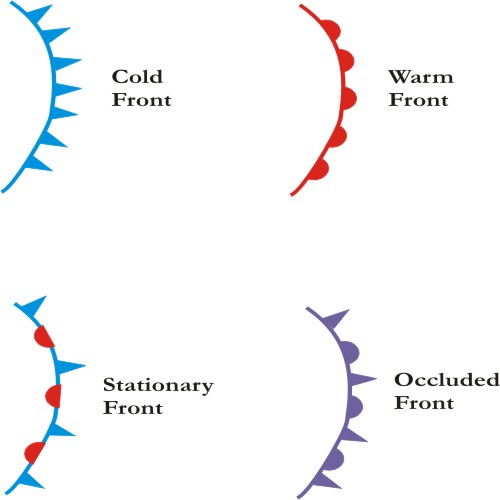
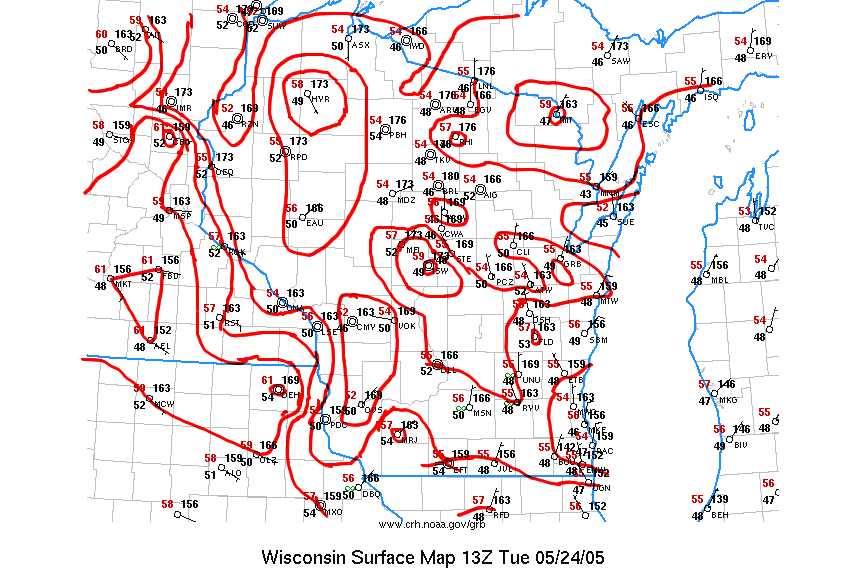
Look for station models on a map. They are of this form:
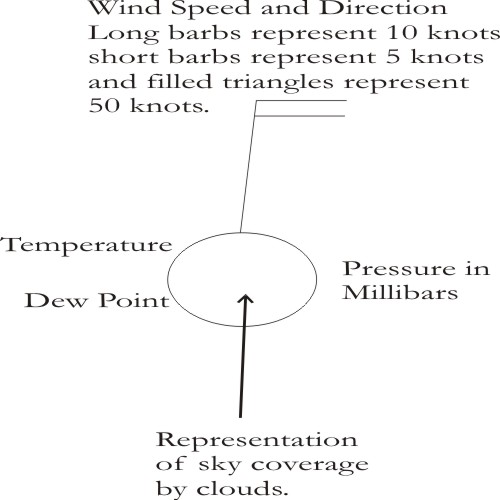
Note that the direction the wind bnarb is pointing is the direction the wind is coming from.
Use a pencil and lightly draw lines between station models that have the same temperature. Boundaries are located where lines of different temperature are nearly parallel. Sharp differences in temperature between stations can indicate the presence of a front. To see good examples of this, look at a surface analysis that plots fronts alongside surface analyses that show only surface models.
Here I do something of this nature on a local map, I draw lines to illustrate every 2 degrees of temperature. Note that I have to guess where these lines will be by comparing the temperatures at various station models.
Amir Mohsen
متخصص بخش هواشناسی
فقط اطلاعات رادیو سوند نمونه آموزشی طوفان و رعد و برق شدید ( ترنادو ) رو داشته باشید!!!!!!
[h=3]Vertical Structure [h=4]The Skew-T Diagram Here is the vertical sounding plot for the night of the Oakfield Tornado in Wisconsin. This type of plot gives us the temperature (right-most thick line), dew point (left-most thick line), and wind (wind barbs on the right) profiles with height. It uses the millibar scale for altitude on the far left side. Temperatures are in the Celsius scale.
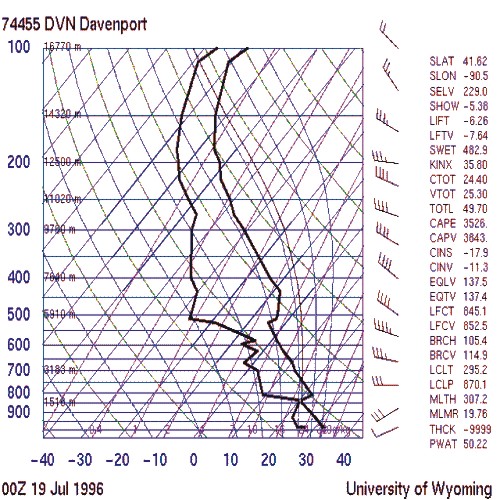
[h=4]The Shear Environment Two types of shear are usually required for severe development (though one will do). The first is directional shear (that is winds at the surface are moving in a different direction than winds at 700 or 600 millibars). The second kind is called vertical speed shear (that is winds increase with altitude). Note the wind barbs on the right-hand side between the surface and 600 millibars have about 30 degrees of directional shear. The surprising thing about this plot is that vertical speed falls off with height. Most storms usually require this to increase with height (we will explain why in the next lesson).
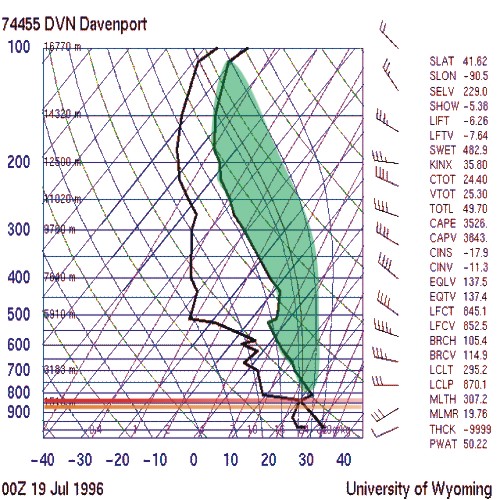
[h=4]CAPE and Other Thermodynamic Aspects of the Thunderstorm Environment The amount of energy available for convection in the atmosphere is called the CAPE (Convective Available Potential Energy). On the chart below this number is the area of the region in green. The larger the area, the more energy is available and the stronger storms will be if this region can be reached by an ascending convective column. The thing that can stop it is the area bounded by the orange and red lines, this is called the Cap and the thicker this layer is the harder it will be for convection to get through it. In this case it represents a layer of warm dry air.
[h=3]Vertical Structure [h=4]The Skew-T Diagram Here is the vertical sounding plot for the night of the Oakfield Tornado in Wisconsin. This type of plot gives us the temperature (right-most thick line), dew point (left-most thick line), and wind (wind barbs on the right) profiles with height. It uses the millibar scale for altitude on the far left side. Temperatures are in the Celsius scale.

[h=4]The Shear Environment Two types of shear are usually required for severe development (though one will do). The first is directional shear (that is winds at the surface are moving in a different direction than winds at 700 or 600 millibars). The second kind is called vertical speed shear (that is winds increase with altitude). Note the wind barbs on the right-hand side between the surface and 600 millibars have about 30 degrees of directional shear. The surprising thing about this plot is that vertical speed falls off with height. Most storms usually require this to increase with height (we will explain why in the next lesson).
[h=4]CAPE and Other Thermodynamic Aspects of the Thunderstorm Environment The amount of energy available for convection in the atmosphere is called the CAPE (Convective Available Potential Energy). On the chart below this number is the area of the region in green. The larger the area, the more energy is available and the stronger storms will be if this region can be reached by an ascending convective column. The thing that can stop it is the area bounded by the orange and red lines, this is called the Cap and the thicker this layer is the harder it will be for convection to get through it. In this case it represents a layer of warm dry air.

Amir Mohsen
متخصص بخش هواشناسی
خوب چطور شد که من امروز در ساعت 12:00 UTC مطمئن به بارش شدم:
1- کیپ قابل توجه روی منطقه و بصورت نقطه روی قله های مرتفع بینالود مشرف به شدت مشهد
2- تراکم خطوط استریم لاین در محدوده شهرهای مشهد و قوچان
3-آبهای قابل بارش بسیار عالی در منطقه
4-مطلب بعدی رطوبت مطلوب در تراز 700 میلی بار که بین 60 الی 80 درصد بوده
5- الگوی باد سطح زمین : دقت کردم در هنگام بارشهای تندری منطقه ما در محدوده ای دایره مانند قرار میگیره که دور تا دورش هم باد شمالی در سطح زمین داره و هم باد جنوب شرقی و در واقع وسط دایره یک حالت سکون مانند جریان هوا بوجود میاد. تقریبا یک چیزی شبیه کم فشار سطح زمین:

پس هر وقت این شرایط بود مطمئن باشید که در ساعات بعدازظهر و اوایل شب یک خبرهایی میشه.
در خصوص مقوله وزش باد این تصویر یک جورایی شبیه وضعیت ما در مواقع وقوع رگبار و رعد و برق هست:

Amir-Hossein
کاربر ويژه
Amir-Hossein
کاربر ويژه
اینم فیلم رعد و برق :خنده1:
فیلمش خیلی کوتاهه و حجمش هم 1 مگابایت :گل::گل::گل:
فیلمش خیلی کوتاهه و حجمش هم 1 مگابایت :گل::گل::گل:
آخرین ویرایش:
Amir Mohsen
متخصص بخش هواشناسی
مشاهده پیوست 55479
امیرمحسن جان ، هر کدوم از عکسها که مناسبه در فروم اکیوودر استفاده کنید...:خجالت2::گل::گل::گل:
امیر حسین جان
تلاش خودم رو کردم ولی ظاهرا سرعت اینترنت مشکل داره و عکسها اونجا اپلود نمیشن !
لینک داینامیک انجمن عکسها رو هم سایتشون قبول نمیکنه!!!
Amir Mohsen
متخصص بخش هواشناسی
جی اف اس همچنان داره واسه مشهد بد اپدیت میکنه!


Amir-Hossein
کاربر ويژه
امیر حسین جان
تلاش خودم رو کردم ولی ظاهرا سرعت اینترنت مشکل داره و عکسها اونجا اپلود نمیشن !
لینک داینامیک انجمن عکسها رو هم سایتشون قبول نمیکنه!!!
فدای سرت محسن جان
هر وقت تونستین بذارین
عکس احمد هم قشنگه
اگه صلاح دونستید بزارین تا خارجی ها هم ببینن و به به و چه چه کنن :خنده2:
Amir Mohsen
متخصص بخش هواشناسی
فرودگاه یک اپدیت رگبار و رعد و برق و دو تا اپدیت هم بارش گزارش کرده ! باید ببینیم چقدر ثبت میکنه!

Amir-Hossein
کاربر ويژه
فرودگاه یک اپدیت رگبار و رعد و برق و دو تا اپدیت هم بارش گزارش کرده ! باید ببینیم چقدر ثبت میکنه!

فک نکنم فرودگاه چیز زیادی اومده باشه
الان هم اصغری چیزی از بارش امروز مشهد و کلا خراسان رضوی نگفت ولی گفت فردا احتمال بارش وجود داره...
Amir Mohsen
متخصص بخش هواشناسی
Amir Mohsen
متخصص بخش هواشناسی
باز خدا پدر و مادر هواشناسی کانادا رو بیامرزه تا 216 ساعت آینده که آپدیت شده اینطوری زده::


Amir-Hossein
کاربر ويژه
باز خدا پدر و مادر هواشناسی کانادا رو بیامرزه تا 216 ساعت آینده که آپدیت شده اینطوری زده::

خدا خیرش بده... :خنده1:
نظر شما چیه داداش ؟ این پیش بینیا درست میگن ، ینی از بارش هفته آینده کاسته خواهد شد؟
نظر شما چیه داداش ؟ این پیش بینیا درست میگن ، ینی از بارش هفته آینده کاسته خواهد شد؟
Amir Mohsen
متخصص بخش هواشناسی
خدا خیرش بده... :خنده1:
نظر شما چیه داداش ؟ این پیش بینی درست میکن ، ینی از بارش هفته آینده کاسته خواهد شد؟
از جی اف اس و نیروی دریایی که خیلی بهتر آپدیت کرده. ولی اصولا بارشهای همرفتی زیاد قابل پیش بینی نیستند!
امروز نروژ واسه مشهد 0 میلیمتر زده بود ولی جی اف اس تقریبا نزدیک 1 میلیمتر زده بود .
Amir Mohsen
متخصص بخش هواشناسی
[h=2]Time: 21:39 (17:09 UTC)[h=4]Current weather observation
| The report was made 9 minutes ago, at 17:00 UTC |
| Wind 7 km/h from south/southeast |
| Temperature 18°C |
| Humidity 83% |
| Pressure 1016 hPa |
| Visibility 10 km or more |
| Few clouds at a height of 1067 m Few clouds at a height of 1219 m , Cumulonimbus. Broken clouds at a height of 3353 m |
seyyedalireza
مدیر موقت
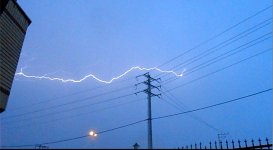
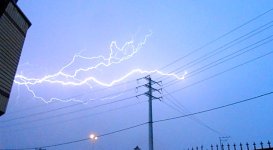
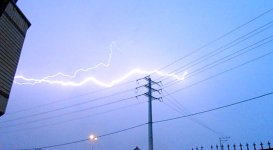
آسمان مشهد.....یک ساعت پیش....ببخشید اگه زشت شد....دفعه اولم بود از رعدوبرق عکس میگرفتم......:گل::گل:
این رعدوبرقو دیدم توی امروز این قویترین رعدوبرق بود واقعا قدرت یک رعدوبرقو نشون میده
Amir Mohsen
متخصص بخش هواشناسی
seyyedalireza
مدیر موقت
آره واقعا !
چتر بالای سرم بود و با محسن داشتم صحبت میکردم و اون بخش فلزی چت روی سینه سمت چبم بود که یک رعد و برق شدید زد و در قسمت چپ بدنم احساس لرزش ناگهانی مثل برق گرفتگی کردم ولی خدا رو شکر از بدنم رد نشد و به زمین نرسید:فرار2:
اقا امیر محسن با خودتون چی کار میکنید ما شما رو لازم داریم ها هواستون باشه کار دست خودتون ندید :خنده1:
29/04/2014 / عربستان سعودی [h=2]حمله میلیونی ملخها به عربستان، بلای جان کشاورزان این کشور شد

در این موقع سال عربستانی ها همواره منتظر ملخ ها هستند تا به شهر و زندگی و مزارعشان حمله کنند، پدیده ای که همواره در این کشور وجود داشته است و زندگی عادی را مختل میکرده. اما تصاویری که ناظران ما ارسال کرده اند، نشان میدهد، ملخ ها امسال با آنچنان حجمی به این کشور حمله کرده اند که اگر بی سابقه نبوده، کم سابقه بوده است و در ویدئوها ابری از ملخ ها مشخص است.
| |
به گفته ساکنان محلی این فوج از ملخ ها روز شنبه وارد خاک عربستان شده اند و ویدئوها نیز در منطقه الحائل در شمال این کشور گرفته شده است. این منطقه جزء معدود مناطقی است که کشاوری در عربستان رونق دارد.
کشاورزان عربستانی همواره با روشن کردن آتش و ایجاد دود در مزارع خود سعی میکنند از میزان هجوم ملخ ها به محصولات خود بکاهند که این بار به هیچ وجه کارساز نبوده است.
مقامات دولتی عربستان مانند سالهای اخیر برنامه هایی برای سمپاشی این حشرات به اجرا درآورده اند و در این راستا از شهروندان عربستانی درخواست کرده اند به هیچ وجه از این ملخ ها به علت آلوده بودن به سموم شیمیایی استفاده نکنند. ملخ در عربستان به صورت نمک سود و خشک شده زیر آفتاب تند این کشور به عنوان وعده غذایی استفاده میشود.
گفته میشود امسال بیش از 800 میلیون ملخ از مصر با عبور از دریا و خشکی به عربستان رسیده است.
| |
شرکت کننده
تیم ناظران
- وضعیت
- موضوع بسته شده است.

