• توجه: در صورتی که از کاربران قدیمی ایران انجمن هستید و امکان ورود به سایت را ندارید، میتوانید با آیدی altin_admin@ در تلگرام تماس حاصل نمایید.

مباحث عمومی هواشناسی

وضعیت
موضوع بسته شده است.

Amir Mohsen

متخصص بخش هواشناسی
Abstract: Severe flooding is in progress over much of Serbia and Bosnia, with the most severe conditions in 120 years of records being reported in parts. Lesser portions of Croatia and Romania have also been affected, as well as other nations elsewhere in south-eastern Europe. This article reviews the synoptic situation and rainfall amounts and then considers the future prospects for the region. Showery conditions are expected to persist, often with slow-moving thunderstorms, although a further episode of persistent and widespread heavy rain is unlikely.

A slow-moving and deep area of low pressure centred over south-eastern Europe resulted in over a month’s rain falling during Wednesday 14 and Thursday 15 May across quite a wide area (Figure 1, below). More locally, amounts are likely to have been even greater.


sbdapuu8wjhrt0r0k5uz.jpg


Precipitation (in mm) over the 7 day period (12th May – 19th May) is shown below (Figure 2), although again amounts will have been in excess of these figures locally


ijz3j802fgo60acak13.jpg


In terms of percentage of normal for the same period, the figures are shown below (Figure 3) …. in excess of 500% of normal.

ieot5tc13f7601nouw.jpg


از قرار دادن ادامه مقاله به دلیل طولانی شدن مطلب و بخاطر تعدد تصاویر و نقشه ها فعلا صرف نظر میکنم.
 

Amir Mohsen

متخصص بخش هواشناسی
Greenland Ice Sheet Melt Could Occur Yearly By 2100
  • Published: May 19th, 2014


By Brian Kahn
Follow @blkahn
In July 2012, Greenland ice sheet watchers sounded the alarm as 97 percent of the ice sheet surface melted. It was a rare occurrence, one that left researchers puzzling over the exact causes and the likelihood it could occur again in the future. New research released Monday sheds light on the causes behind the melt and includes projections that show if greenhouse gas emissions aren’t slowed, it could become a yearly occurrence by 2100. While that would represent a dramatic change, researchers aren’t clear what the ramifications would be.
assets-climatecentral-org-images-uploads-news-7-25-12_andrew_greenlandmeltevent-500x455.jpg
Extent of surface melt over Greenland’s ice sheet on July 8 (left) and July 12 (right). Measurements from three satellites showed that on July 8, about 40 percent of the ice sheet had undergone thawing at or near the surface. In just a few days, the melting had dramatically accelerated and an estimated 97 percent of the ice sheet surface had thawed by July 12. Click on the image for a larger version. Credit: Nicolo E. DiGirolamo, SSAI/NASA GSFC, and Jesse Allen, NASA Earth Observatory
The Greenland ice sheet covers an area of 656,000 square miles, roughly three times the size of Texas, in a miles-thick coat of ice. At its edges, glaciers flow into the sea and lose ice each summer. That annual melt accounts for about 30 percent of current sea level rise.
The interior of the ice sheet is more stable as temperatures generally stay below freezing year-round and highly reflective snow sends much of the sun’s energy back to space. Temperatures did get above freezing in July 2012, but they weren’t hot enough to kickstart the widespread melting. New research in the Proceedings of the National Academy of Sciences shows that soot from forest fires thousands of miles away was what pushed the melt past a tipping point.
That summer, massive forest fires raged throughout Siberia, which contains the world’s largest forest. Soot from those and other fires burning in the U.S. and Canada was swept up to Greenland, settling atop the ice. The dark soot absorbed the sun’s energy, helping heat the snowpack and trigger the huge surface melt.
“We found what was needed was pretty high temperatures along with black carbon to push it over the threshold,” said Kaitlin Keegan, a postdoctoral researcher at Dartmouth University and lead author of the new study. “It looks like you need both to align to cause these widespread melting events.”
It isn't the first time a major meltdown has happened, but it is exceedingly rare. Data from ice cores indicate that the last time a melt of this magnitude occurred was in 1889 when large forest fires also deposited a layer of soot on the ice sheet. In contrast, other years with warm temperatures, notably 1868 and 1908, didn’t see a large-scale melt.
That makes such melts the equivalent of a climate jigsaw puzzle, and what Keegan and her colleagues found is that climate change is likely to make events like the July 2012 event much more common.
Using projections from the latest Intergovernmental Panel on Climate Change (IPCC) report, they modeled both temperature and wildfire changes over the 21st century. High latitude locations such as Greenland have warmed twice as fast as the rest of the globe, a trend that’s expected to continue. If greenhouse gas emissions aren’t slowed, temperatures could rise by as much as 16°F in Greenland by century’s end.
Forest fire frequency is also expected to change as the climate warms. IPCC estimates indicate that for every 1.8°F rise in temperature, forest fire frequency will double.
Using those numbers, the researchers found that the ice sheet could see widespread melting yearly by 2100. Even if emissions are curtailed and the temperature rise in the Arctic region is limited to 3.6°F, the ice sheet could still see a 2012-level melt every 6 years.
“This study represents a useful step toward predicting melt dynamics on the northern hemisphere's largest ice mass,” Joseph Cook, a glacier researcher at the University of Derby who was not involved in the study, said. “This paper adds to an ever-growing body of evidence that melt rates on the Greenland ice sheet will continue to accelerate and enhances our understanding of some of the mechanisms by which this will occur.”
Understanding the effects towards the edges of ice the sheet is a key next step, particularly what, if anything, it could mean for sea level rise. Keegan said it’s hard to glean an answer from the current data and research available because it would be such a dramatic shift.
“We don’t know enough right now, especially a scenario where it’s melting every year. It’s really a totally different system from what we know now,” she said.
 

Amir Mohsen

متخصص بخش هواشناسی
بررسی اپدیتهای امروز:


جی اف اس نسبت به روزهای گذشته آپدیت بهتری داشته.

ECMWF با یک ذره تضعیف بارشها همچنان بدک نیست.

نیروی دریایی و هواشناسی کانادا امروز ، آپدیتهای بسیار بدی داشته اند!
 

Amir Mohsen

متخصص بخش هواشناسی
واسه شهر اشک آباد پایتخت کشور ترکمنستان پیش بینی خیلی خوبی شده پس احتمال شیروان هم شرایطی مشابه خواهد شد. البته گلول و سرانی هم وضع خوبی خواهند داشت چون همرفت های اشک آباد عموما از فراز کوههای گلول و سرانی آغاز میشه:


[h=2]Time: 12:05 (07:05 UTC)
[h=4]Current weather observation
The report was made 5 minutes ago, at 07:00 UTC
Wind 14 km/h from north, varying between west/northwest and north/northeast
Temperature 35°C
Humidity 13%
Pressure 1011 hPa
Visibility 10 km or more
Scattered clouds at a height of 1524 m
Broken clouds at a height of 3048 m
Overcast at a height of 7010 m


[h=4]Forecast
The report was made 2 hours and 3 minutes ago, at 05:02 UTC
Forecast valid from 20 at 06 UTC to 20 at 18 UTC
Wind 22 km/h from west with gusts up to 40 km/h
Visibility 5000 m
Scattered clouds at a height of 1524 m
Scattered clouds at a height of 1524 m , Cumulonimbus.
Probability 40% :
Temporary
from 20 at 10 UTC to 20 at 12 UTC
Wind 22 km/h from south/southwest with gusts up to 40 km/h
thunderstorm
Temporary
from 20 at 12 UTC to 20 at 16 UTC
Wind 32 km/h from variable directions with gusts up to 50 km/h
Visibility 3000 m
blowing widespread dust and light thunderstorm rain
[h=4]Forecast
The report was made 2 hours and 2 minutes ago, at 05:03 UTC
Forecast valid from 20 at 06 UTC to 20 at 18 UTC
Wind 22 km/h from west with gusts up to 40 km/h
Visibility 5000 m
Scattered clouds at a height of 1524 m
Scattered clouds at a height of 1524 m , Cumulonimbus.
Probability 40% :
Temporary
from 20 at 10 UTC to 20 at 12 UTC
Wind 22 km/h from south/southwest with gusts up to 40 km/h
thunderstorm
Temporary
from 20 at 12 UTC to 20 at 16 UTC
Wind 32 km/h from variable directions with gusts up to 50 km/h
Visibility 3000 m
blowing widespread dust and light thunderstorm rain
 

DR WHO

کاربر ويژه

برداشت شما از این تحلیل آماری در خصوص همبستگی ناهنجاری بارش مانسون هند با النینو و لانینا چیست؟


monsoon.png
 

Amir Mohsen

متخصص بخش هواشناسی

[h=3]El Niño: Is 2014 the new 1997?

Tweet


May 19, 2014: Every ten days, the NASA/French Space Agency Jason-2 satellite maps all the world's oceans, monitoring changes in sea surface height, a measure of heat in the upper layers of the water. Because our planet is more than 70% ocean, this information is crucial to global forecasts of weather and climate.
Lately, Jason-2 has seen something brewing in the Pacific—and it looks a lot like 1997.
"A pattern of sea surface heights and temperatures has formed that reminds me of the way the Pacific looked in the spring of 1997," says Bill Patzert, a climatologist at NASA's Jet Propulsion Laboratory. "That turned out to be the precursor of a big El Niño."
A new ScienceCast video examines the evidence that an El Niño is developing in the Pacific. Play it

"We can't yet say for sure that an El Niño will develop in 2014, or how big it might be," cautions Mike McPhaden of NOAA's Pacific Environmental Research Laboratories in Seattle, "but the Jason-2 data support the El Niño Watch issued last month by NOAA."
What Jason-2 has been seeing is a series of "Kelvin waves"—massive ripples in sea level that travel across the Pacific from Australia to South America. Forecasters are paying close attention because these waves could be a herald of El Niño.

The two phenomena, Kelvin waves and El Niño, are linked by wind. Pacific trade winds blow from east to west, pushing sun-warmed surface waters toward Indonesia. As a result, the sea level near Indonesia is normally 45 cm higher than it is near Ecuador. Researchers call that area the “warm pool”—it is the largest reservoir of warm water on our planet.
Sometimes, however, trade winds falter for a few days or weeks, and some of that excess sea level ripples back toward the Americas. "That's a Kelvin wave," says McPhaden. "It's not unusual to see a couple every winter."
El Niño happens when trade winds falter not just for days, but for many months. Then Kelvin waves cross the Pacific like a caravan, raising sea level and leaving warmer equatorial waters in their wake.
On May 8th, the National Centers for Environmental Prediction forecasted a 65% chance of El Niño developing during the summer of 2014. More

"The El Niño of 1997/98 was a textbook example," recalls Patzert. "At that time we were getting data from TOPEX/Poseidon, a predecessor of Jason-2. Sea surface maps showed a whitish bump, indicating a sea level some 10 centimeters higher than usual, moving along the equator from Australia to South America."
"The same pattern is repeating in 2014," says McPhaden. "A series of Kelvin waves generated by localized west wind bursts in the western Pacific that began in mid-January 2014 are headed east. Excitement is building as a third weakening of the Pacific trade winds happened in mid-April."
Ocean and atmospheric scientists at NOAA and NASA are carefully monitoring the Pacific trade winds. The tipping point for declaring a significant El Niño will be an even longer lasting, larger collapse in Pacific trade winds, possibly signaling a shift in weather all around our planet.
"It will become much clearer over the next two to three months whether these recent developments are the forerunner of a major El Niño—or any El Niño at all," says McPhaden.
"Jason-2 is a marvelous Kelvin wave counter," adds Patzert, "and it will tell the tale."


http://science.nasa.gov/science-news/science-at-nasa/2014/19may_elnino/


Amir Mohsen

متخصص بخش هواشناسی
El Nino Is Back: What You Need to Know About the 2014 Version By Danielle Wiener-Bronner 9 hours ago


[h=4]CBS Local [h=3]Is A Drought-Busting El Nino Brewing Out West?
b5a8baff8aca09d8ce592279b82fb54b


CBS DFW


Meteorologists predict that we may see an El Nino in 2014, which means that it might be a good time to brush up on what the heck this supposedly terrifying weather phenomenon actually is. Here's what you need to know.
[h=3]So what is an El Nino? According to NOAA, El Nino "refers to the large-scale ocean-atmosphere climate interaction linked to a periodic warming in sea surface temperatures across the central and east-central Equatorial Pacific." In other words, warmer water in the Pacific that messes up normal weather patterns across our continent.
An El Nino event typically occurs once every several years. The last El Nino we saw was in 2004, but the one before that, in 1997, is considered a textbook example of a strong El Nino. According to NASA climatologist Bill Patzert, "a pattern of sea surface heights and temperatures has formed that reminds me of the way the Pacific looked in the spring of 1997." Data collected by a NASA satellite shows a series of "Kelvin waves," or massive oceanic ripples that could suggest an upcoming El Nino. It will take a few months before we know whether or not we'll seen a El Nino this year. NASA offers some more information on how an El Nino is formed:
RELATED: Police Commissioner Who Defended Racial Slur Against Obama Resigns

[h=3]Was the 1997 El Nino that bad? In a word, yes. In Peru, the weather event caused massive amounts of rainfall which led to deadly flooding and mudslides and cost $2 billion in damage. The climactic changes created Hurricane Linda off the coast of Mexico, which turned into the strongest Eastern Pacific tropical cyclone ever recorded. Another hurricane hit Mexico a month later. The extreme weather spurred cycles of mosquito-transmitted diseases in Africa. Meanwhile, other countries experienced severe drought. In August of 2012, Nature published a report showing that El Nino events "suppress the monsoon rains that usually put a damper on the use of fire to clear land for agriculture." That means more pollution, which means more deaths — as many as 15,000 more in El Nino years, according to the report.
In the U.S., the weather event didn't take quite as much of a toll. According to the Weather Underground, El Nino mostly just caused excessive rainfall in North America:
RELATED: California Chrome's Nasal Strip Gets a Pass Into the Belmont Stakes (Update)
In the U.S., the most significant manifestation of the El Niño were the record rainfalls in California during the water season of 1997-1998. Santa Barbara received 21.74” of precipitation in February alone contributing to its wettest water season on record (July 1-June 30) with a 46.99” total. Other California cities that reported their wettest season on record included Bakersfield (14.66”), Fort Bragg (79.13”), Monterey (47.12”), and Santa Maria (32.56”).
As a result of the environmental tumult, 1998 was one of the hottest years to date.
[h=3]What about the 2014 El Nino? If we do see an El Nino event in 2014, it's not totally clear what that would mean for the U.S. The Midwest could see a cooler than usual— or warmer than usual —summer depending on when the weather event hits, reports CBS Chicago:
According to the National Weather Service, the region has an “enhanced chance” for below normal temperatures from June through August. An El Nino episode is developing in the tropical Pacific, and this tends to favor cooler conditions in the summer here. Timing is the key: If El Nino conditions set up soon, then cooler temperatures are possible. However, if it arrives later there is an equal chance of warmer than average temperatures as well.
Summer weather aside, an El Nino this year could actually be a good thing for the U.S., per the Weather Underground:
Researchers have found that instances of Atlantic tropical storms and hurricanes are usually reduced during an El Niño year. Based on the current model data, it appears that El Niño could develop near the height of the Atlantic hurricane season — potentially inhibiting some tropical development... If El Niño develops, beneficial rains could bring much-needed relief to some drought-stricken areas, most notably California. During El Niño, winters in parts of California are sometimes wetter than normal. But, before the beneficial rains arrive, Californians would likely have to endure a grueling drought through the spring and summer.
In other parts of the world, like Indonesia, an El Nino could mean an unwelcome dry spell. Beyond that, we'll have to wait and see.
 

هادی...

New member
شمارکشته شدگان سیل وصاعقه درشمالغرب کشور در10 روز گذشته به 6 نفر رسید.

متاسفانه دیروز درشهرستان میانه 1 نفر براثر صاعقه جان خود رو ازدست داد.

هفته گذشته هم 2نفر دربوکان،1نفر درمشگین شهر،1نفر درماکو و1 نفر در اسکو براثر سیل وصاعقه جان خود روازدست دادند.


DR WHO

کاربر ويژه
درود و سپاس از پاسخ :گل:


http://eoimages.gsfc.nasa.gov/images/imagerecords/83000/83653/ssha_19970502_20140503_lrg.jpg

چيزى كه برام جالبه اينه كه ال نينو امسال جدى تر و قوى تر از ال نينو سال ٧٦ داره شروع ميشه ! هم دماى مناطق حاره اى خيلى زود داره بالا ميره هم الگوى فشار اتمسفر خيلى زود دگرگون شده . كاملا با يك ال نينو اصيل واقعى كلاسيك سر و كار داريم . در كل حس خوبى به آينده دارم .
 

Amir Mohsen

متخصص بخش هواشناسی


تاثیر پدیده اقیانوسی النینو بر رژیم بارش جهان


50.gif

تاریخ : سه شنبه سی ام اردیبهشت 1393
51.gif

نویسنده : امیر محسن
52.gif

نظر بدهید
النینو

cm2p1_elnino_3d.png

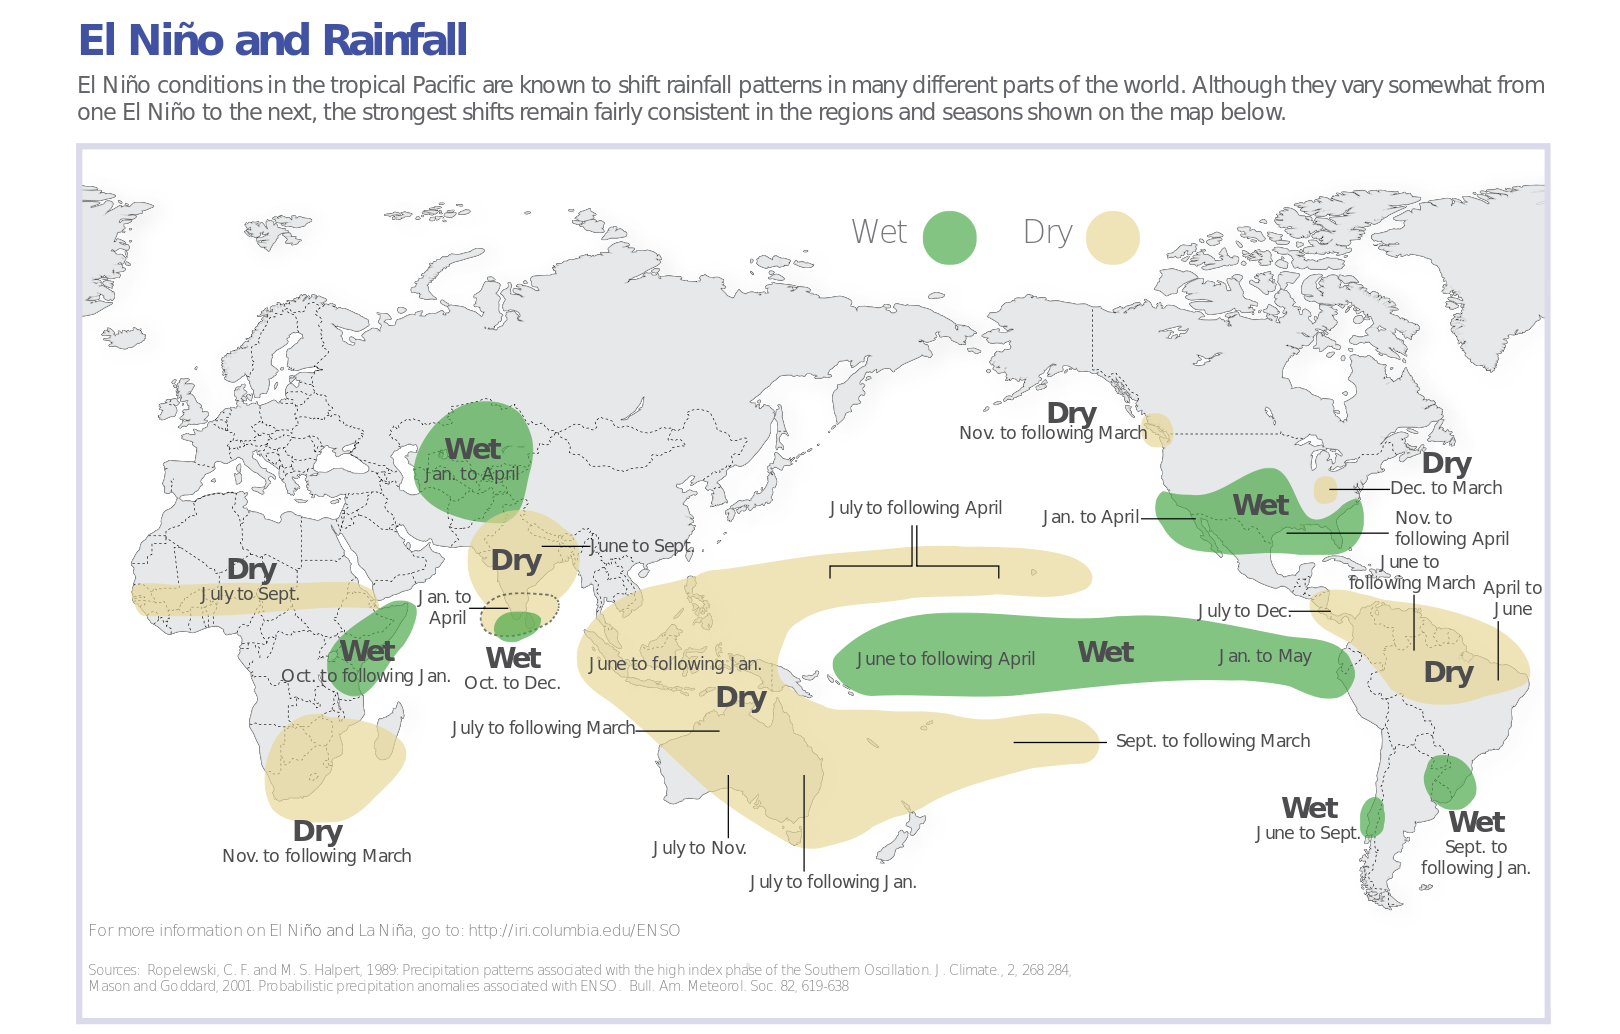
مرکز ملی اقیانوس شناسی آمریکا به تازگی تاثیرات پدیده اقیانوسی النینو بر رژیم بارش جهان را در ماههای مختلف سال به شرح ذیل منتشر کرد.
برای دیدن تصویر در اندازه واقعی لطفا بر روی آن کلیک نمایید
توضیح نقشه: در توضیحات این نقشه آمده است که وقوع پدیده النینو در بخش استوایی اقیانوس آرام منجر به جابجایی الگوی کلی رژیم بارش در دنیا خواهد گردید. هرچند که وقوع پدیده النینو در هر سال از لحاظ تغییرات اقلیمی با سال مشابه قبلی متفاوت خواهد بود( اشاره غیر مستقیم به تاثیرات سایر شاخصهای دورپیوندی و مولفه های اتمسفری) ولی مشخصا تاثیرات این پدیده در نقاطی که در این نقشه به رنگهای سبز ( وقوع ترسالی) و نواحی زرد رنگ( وقوع خشک سالی) از سایر نقاط دنیا پر رنگتر و بارزتر خواهد بود و به احتمال بسیار بالا در شمال شرق ایران - آسیای میانه و کشور افغانستان ما به امید خدا شاهد وقوع ترسالی خواهیم بود.


آخرین ویرایش:

Amir Mohsen

متخصص بخش هواشناسی
توضیح نقشه:

در توضیحات این نقشه آمده است که وقوع پدیده النینو در بخش استوایی اقیانوس آرام منجر به جابجایی الگوی کلی رژیم بارش در دنیا خواهد گردید. هرچند که وقوع پدیده النینو در هر سال از لحاظ تغییرات اقلیمی با سال مشابه قبلی متفاوت خواهد بود( اشاره غیر مستقیم به تاثیرات سایر شاخصهای دورپیوندی و مولفه های اتمسفری) ولی مشخصا تاثیرات این پدیده در نقاطی که در این نقشه به رنگهای سبز ( وقوع ترسالی) و نواحی زرد رنگ( وقوع خشک سالی) از سایر نقاط دنیا پر رنگتر و بارزتر خواهد بود و به احتمال بسیار بالا در شمال شرق ایران - آسیای میانه و کشور افغانستان ما به امید خدا شاهد وقوع ترسالی خواهیم بود.
 

DR WHO

کاربر ويژه
به نظر من ال نينو باعث سرد تر از نرمال شدن پاييز ميشه حداقل براى اصفهان كه اينگونه بوده است ( اشاره دارد به پاييز زودرس و سردتر از هنجار ١٣٨٥ )

حتى به نظر من ال نينو باعث پر برف شدن زمستان هم ميشه مثلا زمستان ١٣٧٠ يا زمستان ١٣٧٦


منظور به اينكه علت گرم شدن زمستانهاى ٨٥ ، ٨٨ و ٩١ ال نينو نبود احتمالا موقعيت نامناسب ورتكس قطبى علت گرم شدن اين زمستانها بوده .

در در كل از نظر من ال نينو = بركت
 

Amir Mohsen

متخصص بخش هواشناسی
تاثیرات النینو و لانینا بر دمای هوای در سطح زمین و در ماههای مختلف سال


پس بعضی سالهایی که النینو بوقوع پیوسته سرد بوده و بعضی گرم و هیچ احدی نمیتونه ادعا کنه النینو بصورت قطعی باعث گرمایش و یا سرمایش در ایران ما میشه.اینو هیچگاه فراموش نکنید:


ElNino+LaNina_maps.gif
 
وضعیت
موضوع بسته شده است.
بالا