-
توجه: در صورتی که از کاربران قدیمی ایران انجمن هستید و امکان ورود به سایت را ندارید، میتوانید با آیدی altin_admin@ در تلگرام تماس حاصل نمایید.
You are using an out of date browser. It may not display this or other websites correctly.
You should upgrade or use an alternative browser.
You should upgrade or use an alternative browser.
تجزیه و تحلیل وضعیت جوی در سال زراعی 93-94 /فصل دوم( دي- بهمن-اسفند)
- شروع کننده موضوع heaven1
- تاریخ شروع
- وضعیت
- موضوع بسته شده است.
seyyedalireza
مدیر موقت
فقط باد میاد ولی وسرما و البته هوا صاف شده
حسین اکبریان
New member
بارش شدید باران در بابل وسوز سرما .خدا را شکر که امسال یه چشمه از زمستون رو دیدیم. امیدوارم این سیبری خفته از خواب نازش هر چه زودتر بیدار بشه ویک دستی بر ما بکشد. دمای هوا 4
Amir Mohsen
متخصص بخش هواشناسی
سلام دوستان عزیز
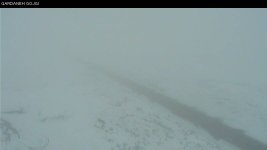
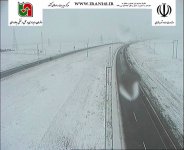
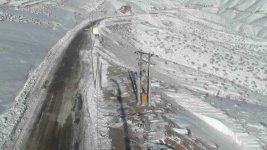
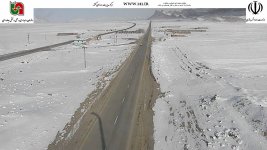
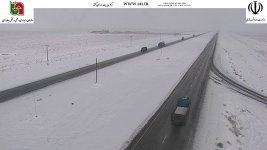
ظاهرا در استانهای کرمان و یزد بارش سنگین برف رخ داد دلایل در آپدیت ساعت 00:00 یو تی سی امروز کاملا مشخصه:

برای دوستانی که علاقه بدونستن اطلاعات بیشتر دارند، به لینک های زیر یک سری بزنند:
Potential vorticity and isentropic charts
اینهم لینک فایل جامع و کامل PDF :
http://www.atmos.illinois.edu/~snesbitt/ATMS505/stuff/12 IPV.pdf
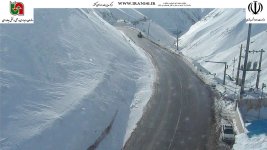
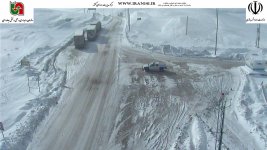
امروز در شرق دریای کاسپین - گلستان و خراسان شمالی با چرخش بسته هوای سرد در سطح زمین امکان بارش باران و برف دور از انتظار نیست که بارش در نواحی سردسیر و مستعد منجر به اختلال در تردد جاده ای به خاطر کولاک برف خواهد شد.
ظاهرا در استانهای کرمان و یزد بارش سنگین برف رخ داد دلایل در آپدیت ساعت 00:00 یو تی سی امروز کاملا مشخصه:

برای دوستانی که علاقه بدونستن اطلاعات بیشتر دارند، به لینک های زیر یک سری بزنند:
Potential vorticity and isentropic charts
اینهم لینک فایل جامع و کامل PDF :
http://www.atmos.illinois.edu/~snesbitt/ATMS505/stuff/12 IPV.pdf
امروز در شرق دریای کاسپین - گلستان و خراسان شمالی با چرخش بسته هوای سرد در سطح زمین امکان بارش باران و برف دور از انتظار نیست که بارش در نواحی سردسیر و مستعد منجر به اختلال در تردد جاده ای به خاطر کولاک برف خواهد شد.
Amir Mohsen
متخصص بخش هواشناسی
شاهرود گردنه ازاد شهر

درسته این موضوع شامل مناطق شمالی استان سمنان هم میشه که از قلم افتاد.
ممنون از یاد آوری
Amir Mohsen
متخصص بخش هواشناسی
سلام و صبح بخیر
این کجاست فرهاد عزیز؟
سلام و صبح بخیر
این کجاست فرهاد عزیز؟
با سلام
چترود - راور استان کرمان
Amir Mohsen
متخصص بخش هواشناسی
این مطلب هم برای اطلاع از کم کیف PV+ خیلی مفید هست:
WAVE - KEY PARAMETERS
by ZAMG
[*=left]Warm advection (WA):
The field of temperature advection is characterized by a juxtaposition of a WA maximum within the cloud bulge and a CA maximum in the dry air behind. This indicates the circulation of air masses within the deepening low (see Meteorological physical background ). In reality the WA maximum can be rather weak while usually a pronounced CA maximum exists behind the cloud bulge. The zero line of the temperature advection passes through the bulge and should mark the centre of the Wave.
[*=left]Positive vorticity advection (PVA):
The cloud bulge is superimposed by a PVA maximum in the higher levels of the troposphere (500 and 300 hPa), indicating the deepening of a low.
Both (WA and PVA) are responsible for the production of the increased cloudiness of the Wave bulge.
[*=left]Absolute topography at 1000 and 500 hPa:
In the absolute topography at lower levels of the troposphere (for instance at 1000 hPa) a low pressure area can be observed which often manifests only as a pronounced trough but sometimes shows already a weak closed circulation intensifying during the life cycle. In upper levels, as for instance at 500 hPa, usually a large scale trough can be observed with cloudiness in the south-western stream.
[*=left]Isentropic potential vorticity (IPV):
According to Hoskins (1986) anomalies of IPV representing very dry stratospheric air can be regarded as being connnected with cyclogenesis. The approach of an IPV anomaly at higher levels in the direction of a low level baroclinic zone may cause cyclogenesis. From present knowledge the Waves described in this chapter are not a typical example for such a development, but very often an anomaly develops upstream on the rear side of the Wave at higher levels around approximately 300 hPa; this is accompanied by the development of a black area in the WV image.
| | 02 October 2002/12.00 UTC - Meteosat IR image; green: equivalent thickness 500/850 hPa; blue: thermal front parameter 500/850 hPa; red: temperature advection 700 hPa |

| 
|
| | 16 January 1996/12.00 UTC - Meteosat IR image; red: temperature advection 500/1000 hPa, green: vorticity advection 500 hPa |

| 
|
| | 16 January 1996/12.00 UTC - Meteosat IR image; cyan: height contours 500 hPa, green: vorticity advection 500 hPa |

| 
|
| | 16 January 1996/12.00 UTC - Meteosat WV image; cyan: potential vorticity 310K, red: isobars 310K |

| 
|
| | 16 January 1996/12.00 UTC - Meteosat WV image; cyan: isentropic potential vorticity on the isentropic surface of 320K, red: isobars |

| 
|
This case shows two Waves: a southern one at approximately 52N/20W (see Meteorological physical background) and a northern one between Greenland and Iceland. For both waves a very classical distribution of the TA field can be recognized with much more cold advection for the northern Wave. The surface layer shows pronounced troughs of which the northern one is already deeper. The field of PVA shows a pronounced maximum for the northern Wave but two separated maxima for the southern one. The latter are correlated with two small scale troughs within the upper levels of 500 hPa.
The last two images contain isentropic potential vorticity lines (in IPV units) on two different isentropic surfaces. The first one (310K) shows in the area of the southern Wave tropospheric air at heights between 500 and 400 hPa, while for the northern Wave stratospheric air has protruded downward as far as 300 hPa. On the 320K surface the same can be seen for the southern Wave.
The last two images contain isentropic potential vorticity lines (in IPV units) on two different isentropic surfaces. The first one (310K) shows in the area of the southern Wave tropospheric air at heights between 500 and 400 hPa, while for the northern Wave stratospheric air has protruded downward as far as 300 hPa. On the 320K surface the same can be seen for the southern Wave.
Amir Mohsen
متخصص بخش هواشناسی
اینهم پدیده آب و هوایی حاصل از این افزایش تاوایی در تراز 300 میلی بار جو:
WAVE - WEATHER EVENTS
by ZAMG
| Parameter | Description |
| Precipitation |
|
| Temperature |
|
| Wind (incl. gusts) |
|
| Other relevant information |
| | 27 September 1995/12.00 UTC - Meteosat IR image; weather events (green: rain and showers, blue: drizzle, cyan: snow, purple: freezing rain, red: thunderstorm with precipitation, orange: hail, black: no actual precipitation or thunderstorm with precipitation) |

| 
|
The image shows within the area of the wave an extended area of precipitation.
Amir Mohsen
متخصص بخش هواشناسی
- وضعیت
- موضوع بسته شده است.


