• توجه: در صورتی که از کاربران قدیمی ایران انجمن هستید و امکان ورود به سایت را ندارید، میتوانید با آیدی altin_admin@ در تلگرام تماس حاصل نمایید.

تجزیه و تحلیل وضعیت جوی در سال زراعی 93-94 /فصل سوم( فروردین- اردیبهشت-خرداد)

وضعیت
موضوع بسته شده است.

heaven1

مدیر بخش هواشناسی
من با این لحن و صحبت شما هیچ حرفی برای گفتن با شما ندارم
اما واسه اون دوستمون که پرسیدن :
فاز مثبتAO به دوره هایی اطلاق می شود كه فشار سطح دریا در قطب شمال زیر معمول باشد . در این حالت بادهای غربی سطح زمین در شمال اقیانوس اطلس تقویت می شود و شرایط گرمتر و مرطوبتر از معمول را در ار وپای شمالی به همراه می آورد. فاز منفی AO نشاندهنده ی فشار بالاتر از معمول بر روی منطقه قطب شمال و كمتر از معمول در عرض های 45 درجه شمالی است.
شاخص NAOحاصل تفاضل فشار مرکز کم فشار ایسلند و فشار مرکز پر فشار جنب حار ه ای می باشد.یعنی NAOشیب فشاری بین این دو سیستم است که شدید و فعال بودن کم فشار ایسلند و پر ارتفاع جنب حا ره ای باعث مثبت شدن شاخص NAOمی شود و ضعیف شدن کم فشار ایسلند و پرارتفاع جنب حا ره ای باعث منفی شدن شاخص NAO می شود.


http://weathernews.mihanblog.com/post/tag/شاخص+AO
http://parno.blogsky.com/page-11
.
.
.
.
شما از اين لينک ها کپي پيست ميکني حداقل رعايت حق مولف هم بکني خوبه!
 

heaven1

مدیر بخش هواشناسی
جهت اطلاعتون:

dmtyk3c4dffxvq0i8lzo.jpg

http://www.erh.noaa.gov/btv/events/Dec1989/figure14.gif
 

heaven1

مدیر بخش هواشناسی
وفتی همه اطلاعات هست و شما خودت نمیدی بخونی من لزومی نمیبینم تایپ کنم!!!!!!!!!!!!!!!1

شما حق مولف رو رعايت کن

حالا اينم واسه شما که ao و nao رو همه چيز ميدونيد
ببينيد که چطور MJO چطور باعث تغيير اين مولفه ها ميشه و در واقع ميبينيد که اين شاخص ها از اين نوسانات mjo تاثير ميپذيرند:


v5w4etzlpise8bhjhjib.png
 

samann

کاربر ويژه
میخوای من تائیدت کنم هادی خان؟
میخوای دیگه نظر مخالف ندم تا راحت باشی؟
باشه اگه اینجوری راحتی . من تائیدت میکنم
 

heaven1

مدیر بخش هواشناسی
شاخص منفیتونم دیدیم!!!!!!!!!! وقفه بارشی.
دیگه چیو میخوای اثبات کنی
هدفت چیه؟
من پیش بینیمو میکنم شما هم پیش بینیتو بکن الان مشکلت دقیقا کجاست؟
از چی میترسی؟
ميخوام بهت ثابت کنم nao و ao شاخص هاي درجه 3 و 4 هستند و از ديگر مولفه هاي آب و هوايي تاثير ميپذيرند

"On the other hand, when the MJO leads the NAO, significant positive NAOs are found for phases 2–4, and negative NAOs for phases 6–8, indicating a significant influence of the tropical MJO on the extratropical NAO variability. On average, the NAO index is positive (negative) 5–15 days after the MJO is detected in phases 2–4 (phases 6–8)"

"Several studies have suggested a possible wintertime connection between the MJO and the extratropical AO (e.g., Zhou and Miller 2005; L’Heureux and Higgins 2008). It was demonstrated that when the MJO-related convection is enhanced (depressed) over the Indian Ocean, the AO tends to favor its positive (negative)
polarity. In these studies, the phase of the AO was determined largely by its North Pacific center, which seems to have a more direct link with the tropical convection anomaly of the MJO"

"An analysis of the evolution of the 500-hPa geopotential height anomaly indicates that the NAO is linked to the equatorial middle Pacific convection anomaly of the MJO through a Rossby wave train
 

heaven1

مدیر بخش هواشناسی
20 Years Ago: The December 1989 Arctic Outbreak across the North Country

Part I - Overview of Surface Weather Conditions
The December 1989 arctic outbreak was a historic event with many all-time record low temperatures set across the central and eastern United States. Locally, in northern New York as well as central and northern Vermont, December 1989 was one of the coldest months on record.

In this write-up, we will investigate how unusual the month of December 1989 was across the North Country. To examine the significance of this event we will review climate data for two sites across Weather Forecast Office (WFO) Burlington (BTV) County Warning Area (CWA). These sites include Burlington (BTV), Vermont, which has 117 years of reliable climate data back to 1891 and St. Johnsbury, Vermont, which is located in eastern Vermont, and has 111 years of dependable climate data back to 1894. Many locations east of the Green Mountains in Vermont did not experience temperatures above freezing for the entire month, with numerous overnight lows temperatures well below zero. Saint Johnsbury recorded its lowest monthly average temperature since records began. Toward the end of the month average daily temperatures along and west of the Champlain Valley warmed to above 32 (F), but east of the Green Mountains stayed below freezing through December 31st.

Through the use of detailed graphs and charts we will show where December 1989 ranked among the top ten coldest months ever and discuss the remarkable change in temperature to above normal levels during January 1990. Furthermore, we will show the large temperature departure from normal at Burlington and St. Johnsbury for December 1989. In Part 2, the large scale synoptic pattern will be investigated, along with differences in the tropospheric flow across the Northern Hemisphere, which contributed to the bitterly cold December 1989 and the anomalously warm January 1990 across the northeastern United States. Furthermore, we will employ teleconnection indices to better calculate the large-scale pattern differences between these two contrasting months and explain the resulting impact on temperatures across the North Country.
Click to enlarge
Figure 1 shows the December monthly average temperature at Burlington from 1891 to 2008 (blue line). The red line shows the December average monthly temperature of 22.4° Fahrenheit (F) for the entire 117-year period of record. Note the average monthly temperature of 7.5° (F) in December 1989, was the coldest December monthly average temperature ever documented at Burlington.

The second coldest December monthly average temperature at Burlington occurred in 1917 of 12.2° (F). This clearly illustrates how bitterly cold the month of December 1989 was, when compared to other December monthly average temperatures at BTV.
Click to enlarge
Figure 2 shows the daily December 1989 maximum and minimum temperatures at Burlington, Vermont compared to normal. The red dotted line signifies the average daily high temperature, while the blue dotted line shows the average daily low temperature. Meanwhile, the solid red line indicates the daily high temperature recorded at Burlington and the solid blue line shows the daily recorded low temperature for the month of December 1989.

Note the warmest high temperature was 41° (F) on the 31st, with the coldest reading of -18° (F) occurring on 24th. From the graphic, only one day (Dec 31st) had above normal temperatures, whereas much of the rest of the month featured daily highs and lows between 15 and 30 degrees below normal.
Click to enlarge
Figure 3 shows a bar graph of the top 10 coldest average December temperatures ever at Burlington, Vermont.

From the graph, the December 1989 average temperature was 7.5° (F), which ranked as the coldest December ever, followed by 12.2° (F) in 1917. This illustrates the long duration and bitterly cold air mass across the North Country.
In the following section we will discuss the data for St Johnsbury, Vermont, located in eastern Vermont. This site has very reliable climate data back to 1894 with only a couple years of missing data (1974, 1975, and 1987). Figure 4 illustrates the December 1989 maximum and minimum temperature trends for St. Johnsbury.
Click to enlarge
The blue line in Figure 4 demonstrates the actual daily high temperature, while the red line shows the daily low temperature during the month of December 1989. Meanwhile, the yellow line is the 111-year average daily maximum temperature and the solid purple line is the average daily minimum temperature at St. Johnsbury.

This data indicates that only December 26th and 31st experienced above normal temperatures for the month, while the coldest overnight low of -26° (F) occurred on the 24th. In addition, 23 nights had low temperatures at or below 0° (F) and several daytime high temperatures never reach 10° (F). The numbers located on the blue and red lines in Figure 4, indicate the actual high and low temperatures respectively at St. Johnsbury during the month of December 1989.
Click to enlarge
Figure 5 below signifies the December 1989 daily average temperature departure from normal at St. Johnsbury. The blue bar lines in the graph below indicate the degrees below normal daily average temperature, while the red bar lines show the number of days where the daily average temperature was above normal. For December 1989 at St. Johnsbury only two days 26th and 31st had above normal daily average temperatures (red bar line) while the rest of the month experienced much below normal temperatures. Numerous days the departure was 15 to 25 degrees below normal, especially between the 20th and 25th of December. The green dotted line is the 111-year December daily average temperature at St. Johnsbury, while the solid black line is the December 1989 daily average temperature. The large spread between the dotted green line and solid black line, suggests the large departure of below normal temperatures which occurred. The actual numbers on the blue bar graphic in figure 5 below, show the average temperature departure from normal in degrees Fahrenheit (F).
Click to enlarge
Figure 6 shows the top ten coldest months on record at St Johnsbury, Vermont. Note December 1989 was the coldest month ever at Saint Johnsbury with a monthly average temperature of 5.5 degrees. The 2nd coldest monthly average temperature at St Johnsbury occurred in February 1934 with a temperature of 6.1 degrees.

Given that December is not typically the coldest month of the year, the fact that December 1989 is the coldest on record for St. Johnsbury and most other sites east of the Green Mountains in Vermont is particularly noteworthy.
Click to enlarge
Figure 7 shows the December 1989 daily average temperature versus January 1990 daily average temperature at St Johnsbury. The red line in the figure below shows the January 1990 daily average temperature, while the blue line below shows the daily average December 1989 temperature at St Johnsbury. The graph clearly shows January 1990 was much warmer than December 1989, with only January 7th daily average temperature of 17.5 degrees, being 3 degrees lower than the December 7th daily average temperature of 20.5 degrees. Also from the graph below the average temperature on 16 January 1990 was 46 degrees, while only 10.5 degrees was observed on 16 December 1989. As much as December 1989 was below normal, January 1990 was much above normal across the North Country, including at St Johnsbury. We will shed further light on the pattern differences between the two months in Part 2.
On a national scale, the December 1989 arctic outbreak was a historic event with many all-time record low temperatures set across the central and eastern half of the United States. This cold outbreak included all-time record low temperatures for the month of December being broken at Kearney and Valentine, Nebraska of -31° (F) and -39° (F) respectively. Meanwhile, across the North Country, Lake Placid in northern New York set an all time record low for December at -29° (F) on the 27th and had 26 days where the low temperature was below zero degrees Fahrenheit. We will now discuss the large-scale synoptic weather pattern that prevailed across the country to produce this extreme and long duration cold outbreak.
Click to enlarge
During this prolonged arctic outbreak several surges of bitterly cold air moved across the central and eastern United States. As an example, Figure 8 shows the Daily Weather Map for 22 December 1989 at 1200 Universal Time Constant (UTC) or 7 AM Eastern Standard Time (EST). The surface analysis revealed an extremely strong anticyclone (1054 millibars, mb) across the Central High Plains with an arctic boundary extending from the Gulf of Mexico into Central Florida. Temperatures beneath this surface high pressure ranged between -20° (F) and -30° (F), with Valentine, Nebraska at -36° (F). These frigid temperatures extended across the Deep South with the freezing line across northern Florida and the southern gulf coast states. In addition, temperatures were well below 0° (F) across the interior Northeast and Great Lakes region. Sub zero readings occurred at Denver, Colorado during this arctic outbreak with a low temperature of -18° (F) on 22 December 1989, which illustrated the depth of this cold air mass. This very cold arctic high pressure tracked from the Central Plains into the Ohio Valley, before departing the east coast toward the end of the month as the flow aloft became zonal and the polar vortex weakened.
Click to enlarge
Figure 9 is a composite reanalysis map of mean sea-level pressure across the United States. The black lines are the sea level pressure contours, while the colored image in Figure 9 is the mean sea-level pressure anomaly. The dark red color in the image indicates 32 to 36 mb above normal high pressure anomaly across the Central Plains, signifying anomalously strong surface high pressure. Surface observations and reanalysis data show sea-level pressure readings associated with this area of high pressure of 1054 mb, which is exceptionally high. This strong Canadian high pressure slowly weakened as it moved into the Ohio Valley, but continued to produce record cold temperatures under mainly clear skies. It's very unusual to observe such high pressure readings so far south, away from the polar region, where this system originated from. Finally, Figure 9 illustrates a strong northerly gradient flow across New York and Vermont created by departing surface low pressure over the Canadian Maritimes and building high pressure from the Central Plains. This, combined with a Hudson Bay polar vortex, produced a series of fast moving arctic boundaries across our region, reinforcing the very cold air mass over the North Country.


Part II - Composite Charts and Teleconnection Indices for December 1989 and January 1990
In this section, we examine how differences in the tropospheric flow across the Northern Hemisphere contributed to the bitterly cold December 1989 and the anomalously warm January 1990 across the northeastern United States. We employ teleconnection indices to better quantify the large-scale pattern differences between these two disparate months.
Click to enlarge
The average daily temperature at Burlington, Vermont changed abruptly on 31 December 1989, bringing to an end the prolonged significantly below normal stretch observed during the entire month to that point (Fig. 10). The shift in the temperature regime couldn't have been more dramatic. The mean temperature of 7.5F for December 1989 was a remarkable 17.3F below the 1971-2000 climatological average for December, while the mean of 29.8F was 11.8F above the 1971-2000 climatological average for January.

Also shown in Figure 10 are the daily teleconnection indices for the Pacific North American (PNA) index, the North Atlantic Oscillation (NAO), and the Arctic Oscillation (AO) (we will go into some detail to quantify the PNA, NAO, and AO later in this section). These indices help climatologists and extended range forecasters quantify important aspects of the hemispheric flow pattern as it relates to features such as upper-level troughs and ridges, and their position and strength relative to their mean (preferential) locations. Such differences in the upper flow pattern can significantly impact regional temperature and precipitation over the period of days, weeks, or even months. As will be shown, the tropospheric flow pattern around the Northern Hemisphere and associated teleconnection indices differed markedly between the December 1989 and January 1990.
Click to enlarge
Monthly average temperatures of 6 to 8C below the climatological mean covered a large region from the south-central United States, through the Ohio Valley, and into the northeastern United States and Southeastern Canada during December 1989 (Fig. 11a).

The average temperature departure during January 1990 flipped sign, with surface temperatures around 6C above normal across large portions of the Dakotas, upper Mississippi River Valley and the northeastern United States / southeastern Ontario (Fig. 11b).
Click to enlarge
Examination of the flow pattern at 250 mb for December 1989 showed a distinct ridge of high pressure off the west coasts of the United States and Canada, and a downstream trough of low pressure over the eastern third of the United States and Canada (Fig. 12a). This trough of low pressure would help promote surface air masses, which would likely consist of colder and drier air, to move from northern Canada down into the northeast United States. Another feature to support this idea is the strong jet stream winds noted from the Mid Atlantic/Southeast United States region east-northeastward into the Atlantic Ocean (Fig. 12a). The strong winds imply a sharp surface temperature gradient would exist over the Northeast United States (warmest air at the surface near the jet stream and colder surface air to the north). In contrast, January 1990 showed a flow pattern with a west-southwest to east-northeast orientation essentially across the entire United States (Fig. 12b). This suggests weather systems and their associated air masses (warmer and more moist conditions) would have origins over the Pacific Ocean or the continental United States and any colder air masses in Canada would remain north of the region.
Click to enlarge
Similar to the scenario observed at 250 mb (Fig. 12a and 12b), the average 500 mb pattern for December 1989 showed an upper level ridge of high pressure off the Pacific Northwest Coast and western Canada (Fig. 13a). Further east, a trough of low pressure existed over the eastern third of the United States and Canada. Both features were stronger than normal and this contributed to the colder air masses over northern Canada being able to make their way down into the northeast United States. In January, the pattern changed across the United States with no distinct troughs and ridges and a general flow pattern from west to east (Fig. 13b). This flow pattern would be conducive for air masses moving into the northeast United States from the Pacific Ocean or continental United States. These air masses brought milder air into the region while colder air masses remained north of the border in Canada. Another pattern change of note occurred between December 1989 and January 1990 in the area of Greenland and Iceland. A ridge of high pressure existed over this area in December, but was replaced by a trough of low pressure in January of 1990. This change contributed to the above normal pattern over the eastern United States, which in turn produced the warmer weather.
Click to enlarge
In the animated GIF showing daily 500 mb height anomalies across the Northern Hemisphere (Fig. 14), strong and persistent positive height anomalies are evident across western North America northward into the vicinity of the North Pole, and westward into the eastern Pacific Ocean during December 1989. Similarly, a persistent positive height anomaly is found during December 1989 across Greenland and Iceland, which retrogrades westward into northern Canada and weakens during the second half of the month. As this occurs, an anomalously strong height ridge builds northward across the central Atlantic, preceding a change to generally negative height anomalies across Greenland/Iceland during January 1990. Also, during January 1990, a north-south dipole of high over low height anomalies exists across the central and eastern Pacific Ocean, which is associated with a stronger than normal jet stream across this region into the West Coast of the United States. Thus, pacific air masses were favored across the contiguous United States during a period of more zonally oriented flow and progressive eastward movement of shortwave troughs across the country during January 1990.
Click to enlarge
The December 1989 850 mb average temperatures clearly showed the presence of lower level cold air over the eastern third of the country. Average temperatures for the month of December were generally six degrees Celsius below normal over the northeast United States (Fig. 15a).

In January however, average temperatures were 4 to 5 degrees Celsius above normal (Fig. 15b). This sharp contrast was once again the result of December having air masses moving down from Canada, which brought the colder air to the North Country, while a westerly flow aloft in January brought milder air into the region and kept the colder air further north in Canada.
Click to enlarge
The Mean Sea Level Pressure pattern in December 1989 indicated a stronger than normal low pressure system over the northern Atlantic and a high pressure system over the western United States (Fig. 16a). The resulting surface flow pattern over northern New England was from the northwest, which helped bring colder air into the region from Canada.

By January of 1990, the pattern had changed with a slightly stronger than normal low pressure system over the Northern Plains and south central Canada and a high pressure system over much of the Atlantic Ocean (Fig. 16b). The surface flow pattern was now typically from the southwest, which allowed milder air to move into the region.
To better understand differences between positive and negative phases of the North Atlantic Oscillation (NAO), the Arctic Oscillation (AO), and Pacific / North American (PNA) teleconnection patterns, we will examine associated hemispheric flow when these indices are at their maximum and minimum daily values during the December 1989 / January 1990 period, and relate their phase to temperature conditions across the North Country.

The NAO is a measure of the mid-tropospheric flow variability across the central and high latitudes of the North Atlantic basin, as explained in further detail here (http://www.cpc.noaa.gov/data/teledoc/nao.shtml). A negative NAO (-NAO) means that the mid-tropospheric height regime features a north-south dipole of anonymously high geopotential heights across Greenland / Iceland, and lower than normal geopotential heights in the central Atlantic between 35 and 40 degrees North. The dipole is opposite during +NAO, with a stronger than normal mid-tropospheric low across Greenland/Iceland, and above normal heights in the central North Atlantic between 35 and 40 degrees North. Typically, +NAO will be associated with above normal temperatures across the eastern United States, while negative phases (-NAO) are associated with below normal temperatures. We can better visual and understand the impact of the NAO by looking at some examples during our period of interest.
Click to enlarge
During December 1989, the NAO had a negative phase on 25 out of 31 days. The daily NAO index was most negative on 10 December 1989 (-1.704). The 500 mb height pattern on this day featured a high amplitude ridge extending from the British Isles northwestward across Iceland and across central Greenland. Meanwhile, a deep, closed 500 mb low was located just east of Newfoundland, and a high over low height anomaly (blocking) pattern is evident (Fig. 17a). The downstream mid-level ridge exists as a block, maintaining below normal height conditions across the western Atlantic and eastern North America which is typically associated with colder temperatures. The 250 mb jet stream is also displaced southward in a -NAO pattern (Fig. 12a) with lower 250 mb wind speeds across south-central Canada, allowing for a more equatorward movement of arctic air masses from northern Canada into the central and eastern United States. The opposite is true during a +NAO, the mid to upper level westerlies are stronger further north, which limits the equatorward movement of arctic air into the United States. During January 1990, the NAO was positive on 27 of 31 days, and most positive on 23 January. On 23 January, the Icelandic low is stronger than normal with a northward displaced ridge and anonymously high 500 mb heights across the central North Atlantic around 40N (Fig. 17b). The +NAO phase tends to favor a stronger and more zonal 250 mb flow across south-central Canada, as can been seen comparing the mean 250 mb heights and isotachs for December 1989 (Fig. 12a) and January 1990 (Fig. 12b). There is likewise less ridging across the west coast of North America during the +NAO phase, and a stronger Pacific jet impinging on British Columbia and the coast of the northwestern United States. Upper level troughs were generally more mobile, tracking eastward across the CONUS during January 1990. Conversely, the west coast ridge and split upper flow regime prevented this during much of December 1989 (e.g., see Fig. 14 500 mb height anomaly loop).
 

heaven1

مدیر بخش هواشناسی
The AO phase is associated with eastern United States temperatures in a manner analogous to the NAO, but the AO is more difficult to conceptualize. The AO is related to the 1000 mb (low-level) height anomaly field across the Northern Hemisphere poleward of 20 N latitude. When the AO is negative (-AO), the 1000 mb heights tend to be above normal across the high latitudes of the Northern Hemisphere, whereas a +AO tends to be associated with below normal 1000 mb heights across the higher latitudes. Why is this important? If below normal 1000 mb heights exist (or similarly, below normal sea-level pressure) across the higher latitudes (i.e., a +AO pattern), it is typically the case that the mid to upper tropospheric westerlies are stronger and displaced northward. There is less meridional flow at the higher latitudes to result in the southward movement of arctic anticyclones into the mid-latitudes. During -AO, the higher heights typically result in weaker zonal flow at the higher latitudes, leading to increased opportunities for arctic intrusions southward from Canada in the United States.
Click to enlarge
The NOAA/Climate Prediction Center has developed statistics relating the AO phase to surface temperatures across the central and eastern United States during meteorological winter (December, January, and February). The statistics indicate that mean temperatures tend to be below normal during a -AO across the northern Plains into the Midwest and northeastern States (a function of arctic anticyclones migrating southward into the northern high plains), and vice versa for a +AO (Fig. 18). It is sometimes the case that the combination of a -AO and -NAO results in a more pronounced negative temperature anomaly across the northeastern United States; note that both indices were generally negative during December 1989.
Click to enlarge
For December 1989, the AO had a negative phase on 19 out of 31 days. As in the NAO case, the daily AO index was most negative on 10 December 1989 (-3.482). The positive 1000 mb height anomalies were prevalent across much of Canada and around the North Pole (Fig. 19a). The opposite was true when the AO reached +2.595 on 8 January 1990 (Fig. 19b), with below normal 1000 mb heights across much of Canada and around the pole, when zonal flow was stronger and temperatures across the North Country were above normal. During January 1990, a +AO index existed on 27 out of 31 days, a significant change from the previous month.
Click to enlarge
The PNA phase also underwent a significant change between December 1989 and January 1990. The PNA is said to be in a positive phase (+PNA) when there is a mid-tropospheric ridge across western North America and a trough across eastern North America. The opposite applies for -PNA. During December 1989, a positive PNA index was present on 26 of 31 days. The PNA index was highest on 2 December 1989 (+1.952), when a high amplitude 500 mb ridge existed across the Intermountain West northward across all of western Canada, with generally lower than normal heights across the eastern United States and adjacent waters of the western Atlantic (Fig. 20a). The presence of the 500 mb ridge across western North America resulted in the poleward movement of arctic air masses during much of December 1989 into the central and eastern United States. Like the AO and NAO, the PNA index flipped sign, with a -PNA index present for 19 of 31 days in January 1990. Conditions on 26 January 1990 are representative of a +PNA, with negative height anomalies present over western Canada and the northwestern U.S. and a strong ridge axis across southeastern Canada (Fig. 20b). The result of the +PNA pattern is a stronger than normal zonal Pacific upper jet stream yielding generally westerly flow across the contiguous U.S., with a more progressive wave train of shortwave troughs and ridges, and fewer and limited duration intrusions of arctic air from the north.


Summary
In summary, we have discussed how the large-scale flow pattern and teleconnection indices yielded significant changes in the weather pattern between December 1989 and January 1990. While we have been able to relate aspects of the observed PNA, NAO, and AO teleconnection indices to the hemispheric flow pattern as well as regional temperature variations for the period in question, the ability to predict such pattern shifts is significantly more difficult. The NOAA/Climate Prediction Center employs global model ensembling and other techniques to forecast significant large-scale pattern shifts in these and other teleconnection indices, but in general, atmospheric predictability decreases at increasing time ranges owing to Chaos Theory and other climatic influences not considered here. That said, it is instructive to understand the favored modes of hemispheric atmospheric flow, and monitor numerical model forecasts for potential changes as dramatic shifts have a significant impact on regional-scale temperature and precipitation regimes on time scales of several weeks. Such a dramatic shift in the hemispheric flow pattern was evident during the intriguing stretch of weather across the North Country during December 1989 and January 1990.

Acknowledgements: The Northern Hemispheric composite images shown in this section are based on the NCEP/NCAR Reanalysis Data. Imagery was produced by NOAA/ESRL Physical Sciences Division, Boulder Colorado from their Web site at http://www.esrl.noaa.gov/psd/.
 

samann

کاربر ويژه
شما حق مولف رو رعايت کن

حالا اينم واسه شما که ao و nao رو همه چيز ميدونيد
ببينيد که چطور MJO چطور باعث تغيير اين مولفه ها ميشه و در واقع ميبينيد که اين شاخص ها از اين نوسانات mjo تاثير ميپذيرند:


v5w4etzlpise8bhjhjib.png

عزیزه من وقتی تعریف شاخص اینه دیگه باید چیکار کنم؟ اون کپی رایت که شما میفرمایید مربوط به دانشی است که شخص خودش و طبق تحقیق شخصیش بدست اورده . نه اینکه ترجمه از شخص اولیه کرده؟ اوکی!!!!
 

samann

کاربر ويژه
ميخوام بهت ثابت کنم nao و ao شاخص هاي درجه 3 و 4 هستند و از ديگر مولفه هاي آب و هوايي تاثير ميپذيرند

"On the other hand, when the MJO leads the NAO, significant positive NAOs are found for phases 2–4, and negative NAOs for phases 6–8, indicating a significant influence of the tropical MJO on the extratropical NAO variability. On average, the NAO index is positive (negative) 5–15 days after the MJO is detected in phases 2–4 (phases 6–8)"

"Several studies have suggested a possible wintertime connection between the MJO and the extratropical AO (e.g., Zhou and Miller 2005; L’Heureux and Higgins 2008). It was demonstrated that when the MJO-related convection is enhanced (depressed) over the Indian Ocean, the AO tends to favor its positive (negative)
polarity. In these studies, the phase of the AO was determined largely by its North Pacific center, which seems to have a more direct link with the tropical convection anomaly of the MJO"

"An analysis of the evolution of the 500-hPa geopotential height anomaly indicates that the NAO is linked to the equatorial middle Pacific convection anomaly of the MJO through a Rossby wave train
اولا که درجه 3 و 4 نیستن و درجه 2 هستن.
در ثانی اوکی قبول . اصلا nao از mjo تاثیر میگیره. وقوع فاز مثبتش که در فاز 2 تا 4 mjo رخ میده واسه ما خوبه. اینجوری بهتر شد؟
 

samann

کاربر ويژه
ما چه کار کنیم تو با ما دوست باشی هادی خان؟
ناسلامتی همشهری هستیم ها:ایرانجمن:
 

heaven1

مدیر بخش هواشناسی
میخوای من تائیدت کنم هادی خان؟
میخوای دیگه نظر مخالف ندم تا راحت باشی؟
باشه اگه اینجوری راحتی . من تائیدت میکنم
شما هر وقت کم مياري مغلطه ميکني و بحث رو ميخواي منحرف کني
photo_2015-03-21_21-41-28.jpg
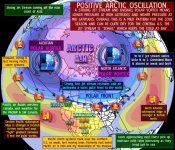
Typical effects of a positive Arctic Oscillation include a strong west-to-east (zonal) jet stream and lower pressure near the poles. Higher pressure at middle latitudes produces mild weather. The pattern can be a dry one for the U.S. when not modulated by other patterns such as the Pacific North American (PNA) El Nino or La Nina

1.jpg

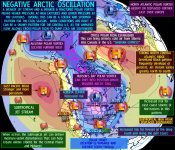
“Classic” or typical weather patterns when the Arctic Oscillation is in negative mode. A weaker jet stream and fractured polar vortex allow large north-south swings in the river of air that is the polar jet. Blocking near Greenland is typically established which funnels cold air out of the Arctic into the central and eastern U.S. The subtropical jet, when active, can interact with the cold for major winter storms

2.jpg
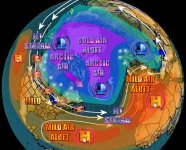
A positive North Atlantic Oscillation (+NAO) typically results in a contained polar vortex with an polar low centered over the Greenland/Iceland area. Arctic air tends to shift east across Canada rather than dropping southward into the U.S. The subtropical ridge is stronger and further north, with warm and dry weather from the central and eastern U.S. to the coast. Warm and wet weather is more common in northern Europe with warm and dry weather over the Mediterranean.

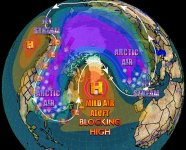
A negative North Atlantic Oscillation (-NAO) typically results in blocking over the north Atlantic near Greenland and a stronger polar low near Hudson’s Bay. This can act to funnel Arctic air southward into the central and eastern U.S. The subtropical high is weak over the Atlantic with cold intrusions more likely into northern Europe and wet weather over the Mediterranean.

3.jpg
 

samann

کاربر ويژه
شما هر وقت کم مياري مغلطه ميکني و بحث رو ميخواي منحرف کني
مشاهده پیوست 61510
Typical effects of a positive Arctic Oscillation include a strong west-to-east (zonal) jet stream and lower pressure near the poles. Higher pressure at middle latitudes produces mild weather. The pattern can be a dry one for the U.S. when not modulated by other patterns such as the Pacific North American (PNA) El Nino or La Nina

مشاهده پیوست 61511

“Classic” or typical weather patterns when the Arctic Oscillation is in negative mode. A weaker jet stream and fractured polar vortex allow large north-south swings in the river of air that is the polar jet. Blocking near Greenland is typically established which funnels cold air out of the Arctic into the central and eastern U.S. The subtropical jet, when active, can interact with the cold for major winter storms

مشاهده پیوست 61512
A positive North Atlantic Oscillation (+NAO) typically results in a contained polar vortex with an polar low centered over the Greenland/Iceland area. Arctic air tends to shift east across Canada rather than dropping southward into the U.S. The subtropical ridge is stronger and further north, with warm and dry weather from the central and eastern U.S. to the coast. Warm and wet weather is more common in northern Europe with warm and dry weather over the Mediterranean.

A negative North Atlantic Oscillation (-NAO) typically results in blocking over the north Atlantic near Greenland and a stronger polar low near Hudson’s Bay. This can act to funnel Arctic air southward into the central and eastern U.S. The subtropical high is weak over the Atlantic with cold intrusions more likely into northern Europe and wet weather over the Mediterranean.

مشاهده پیوست 61513
نه عزیزم من نمودار ندیدم
باید بهت عرض کنم من یه تحقیق اماری کردم از سالهایی که شاخص مثبت و منفی بوده و با امار بارشی ایستگاه مشهد مقایسه کردم. و مصرا مقیدم به این حرف که فاز مثبت باعث پر بارشی ما میشه. و این نقشه های کلی شما رو هم چون تحقیق اماری کردم قبول نمی کنم. حالا چه کار کنم؟
 

heaven1

مدیر بخش هواشناسی
ما چه کار کنیم تو با ما دوست باشی هادی خان؟
ناسلامتی همشهری هستیم ها:ایرانجمن:

من مشکلي با شما ندارم
مشکلم با طرز تفکر شماست
شما متوجه نشديد به خاطر رفتار شما و دوست عزيزتون امير محسن اينجا را ترک کرد؟
ولي از اينکه با اينکه با سند به شما ثابت ميکنم نظرتون اشتباهه ولي هيچوقت اشتباهتون را قبول نکرديد
 

samann

کاربر ويژه
نه عزیزم من نمودار ندیدم
باید بهت عرض کنم من یه تحقیق اماری کردم از سالهایی که شاخص مثبت و منفی بوده و با امار بارشی ایستگاه مشهد مقایسه کردم. و مصرا مقیدم به این حرف که فاز مثبت باعث پر بارشی ما میشه. و این نقشه های کلی شما رو هم چون تحقیق اماری کردم قبول نمی کنم. حالا چه کار کنم؟
در ضمن این یکی دیگه کپی رایتش از خودمه:تعجب2:
 

samann

کاربر ويژه
من مشکلي با شما ندارم
مشکلم با طرز تفکر شماست
شما متوجه نشديد به خاطر رفتار شما و دوست عزيزتون امير محسن اينجا را ترک کرد؟
ولي از اينکه با اينکه با سند به شما ثابت ميکنم نظرتون اشتباهه ولي هيچوقت اشتباهتون را قبول نکرديد
میشه دقیق بگی من چیکار کردم؟ چندین بار خود من امدم گفتم محسن بیاد. الان هم طرز تفکر من نیست. من به محسن گفتم این وضعیت به نفع شمال شرق نیست و دیدید که نبود و به نفع غرب بود .دروغ گفتم؟
 

samann

کاربر ويژه
در ضمن من هم دلم واسه امیر محسن و تحلیل هاش تنگ شده.
اگر از دست من ناراحت شده من ازش معذرت میخوام و خواهش میکنم ازش که برگرده/
چون این جمع به خاطر محسنه که اینجا جمع شده
 
وضعیت
موضوع بسته شده است.
بالا