-
توجه: در صورتی که از کاربران قدیمی ایران انجمن هستید و امکان ورود به سایت را ندارید، میتوانید با آیدی altin_admin@ در تلگرام تماس حاصل نمایید.
You are using an out of date browser. It may not display this or other websites correctly.
You should upgrade or use an alternative browser.
You should upgrade or use an alternative browser.
مباحث تخصصی هواشناسی و بررسی تاثیرات شاخصهای دور پیوندی و مولفه های اتمسفری در تابستان و پاییز و زمستان 1393
- شروع کننده موضوع heaven1
- تاریخ شروع
Amir Mohsen
متخصص بخش هواشناسی
خبری بسیار مهم در مورد النینو:

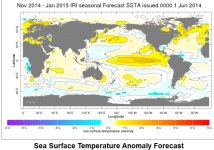
An El Niño is predicted to develop later this year and is expected to last through at least February 2015.
Based on past experience, this translates to a period of heightened likelihood that extreme weather
conditions can occur with associated health impacts. Understanding and monitoring the emerging
climatic conditions offers an opportunity to improve regional, national and sub-national health system
preparedness that can prevent avoidable negative health impacts attendant with El Niño.
In the last 25 years, there have been six moderate-to-strong El Niño events: 1991-2, 1994-5, 1997-8
2002-3, 2006-7, and 2009-10. The impacts of El Niño are felt most strongly in the tropics. Previous
events have been associated with drier- and hotter-than-normal conditions in some regions and seasons
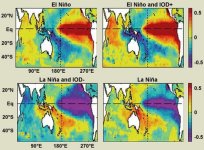
and wetter- and cooler-than-normal conditions in others (Fig. 1). El Niño tends to increase atmospheric
temperatures across the tropics, but the local effects will in part be driven by rainfall, since cloud cover
tends to increase minimum and decrease maximum temperatures. Thus, El Niño will reinforce maximum
temperatures under drier-than-normal conditions and minimum temperatures under wetter-than-normal
تاریخ انتشار 23 ژوئن 2014
فورمت فایل PDF
حجم: 1.8 مگ
http://iri.columbia.edu/wp-content/uploads/2014/06/ElNinoBulletinJuneFINAL.pdf
El Niño 2014: What it is, when it's coming, and what to expect (+video)
El Niño, a tropical-climate phenomenon with a global reach and following, is stirring in the Pacific, although forecasters aren't ready to pronouncing it awake just yet.
It's warming effect on Earth's climate can lower winter heating bills in some regions and reduce the formation and growth of Atlantic hurricanes. But it also alters rainfall patterns in ways that increase the risk of floods in some areas and drought in others.
The '97-'98 El Niño, the strongest on record, is estimated to have caused $35 billion to $45 billion in damage globally and 23,000 fatalities.
Here’s a look at what to expect this time:
By Pete Spotts, Staff writer JUNE 23, 2014
1. What is El Niño and how does it work? (+video)
Marcio Jose Sanchez/APView Caption1 of 2
El Niño occurs when easterly trade winds in the tropical Pacific relax – even reverse – to allow a vast pool of warm water piled up in the western tropical Pacific to move east until it reaches the west coast of Central and South America, leading to higher-than-normal sea-surface temperatures across the equatorial Pacific.
As the ocean releases its heat and moisture to the atmosphere, intense thunderstorms once cooped up over the western Pacific spread along the equator as well. The cumulative effect of this activity changes large-scale circulation patterns at higher latitudes, altering storm tracks that change the typical distribution of rain and snowfall, as well seasonal temperatures.
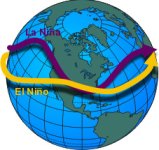
La Niña, El Niño's sibling, throws the process into reverse, bringing cooler-than-normal sea-surface temperatures to much of the tropical Pacific. They form a cycle known as the El Niño-Southern Oscillation, or ENSO. El Niños occur on average every four to seven years and can last up to two years.
1 of 5
Sudden jump in water temperatures evidence of ‘irreversible’ El Nino
June 23, 2014, 4:47 pm
Alicia Villegas
Water temperatures in the equatorial Pacific Ocean increased drastically last week, prompting expectations of an upward warming trend that would confirm the development of El Nino.
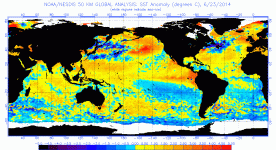
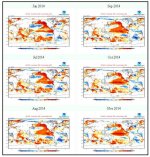
Sea surface temperature (STT) anomalies in the Nino 3.4 region (see image below) showed the highest value of the year at +0.9ºC on June 20, according to data from NOAA seen by Undercurrent News.
This is important to define the event as El Nino since scientists classify the intensity of the weather phenomenon based on STT anomalies exceeding a pre-selected threshold in a certain region of the equatorial Pacific.
The most commonly used region is the Nino 3.4, and the most commonly used threshold is a positive STT departure from normal, greater than, or equal to +0.5°C.
Thus, NOAA defines El Nino as five consecutive overlapping 3-month periods at or above the +0.5°C anomaly in the Niño 3.4 region.
‘A very strong El Nino’
The growth of temperature anomalies from +0.4°C in mid-April to +0.9°C now has encouraged projections of an upward warming trend confirming the development of El Nino.
“This is a big jump in temperature, from now on waters will hardly be cooled, the event is irreversible,” oceanic scientist Luis Icochea told Undercurrent.
Icochea, who in April said that abnormally high temperatures were reminiscent of 1997-98 – when took place one of the strongest El Nino’s ever – is confident El Nino will develop this year.
“Everything suggests El Nino will be very strong, without ruling out the possibility of an extraordinary event,” Icochea said.
Abnormalities of sea surface temperature in Peru have been noticed already in May, as anchovy has moved to the south, near the shore, where industrial fleet is not allowed to operate.
In the north-center area — with a first anchovy season’s TAC of 2.53 millon metric tons — industrial fleet is seen poor catches so far.
By June 11, industry players said only 36% of the anchovy’s total allowable catch had been caught.
“Fishmeal players in Peru will be the most harmed by El Nino, as anchovy is the resource most affected by the weather event,” Icochea said.
To avoid the increased temperatures, pelagic fish such as anchovy will have to move to cooler, deeper waters where feed is available and there are suitable oceanographic conditions.
On the other hand, the phenomenon could mean higher catches of other species for human consumption such as hake — which is showing already a biomass improvement — tuna, mahi mahi, swordfish or shark, Icochea said.
(Phys.org) —The passageway that links the Pacific Ocean to the Indian Ocean is acting differently because of climate change, and now its new behavior could, in turn, affect climate in both ocean basins in new ways.
UH Mānoa physical oceanographer James Potemra is co-author of a study led by Janet Sprintall of Scripps Institution of Oceanography at UC San Diego. The scientists have found that the flow of water in the Indonesian Throughflow – the network of straits that pass Indonesia's islands – has changed since the late 2000s under the influence of dominant La Niña conditions. The flow has become more shallow and intense in the manner that water flows through a hose that has become kinked. The study suggests that human-caused climate change might make this characteristic a more dominant feature of the throughflow, even when El Niño conditions return.
Sprintall and colleagues have spent more than a decade understanding the dynamics of the throughflow, an ocean region that acts like a cable sending information between two electronic devices. The Indonesian seas are the only tropical location in the world where two oceans interact in this manner. The throughflow has an effect on the climate well beyond its boundaries, playing a role in everything from Indian monsoons to the El Niño phenomena experienced by California.
"This is a seminal paper on a key oceanographic feature that may have great utility in climate research in this century," said Eric Lindstrom, a physical oceanography program scientist who co-chairs the Global Ocean Observing System Steering Committee at NASA, which funded Sprintall's portion of the study. "The connection of the Pacific and Indian oceans through the Indonesian Seas is modulated by a complex circulation, climate variations, and sensitive ocean-atmosphere feedbacks. It's a great place for us to sustain ocean observations to monitor potential changes in the ocean's general circulation under a changing climate."
Sprintall, a physical oceanographer at Scripps Oceanography, said this new research starts a new chapter in the history of the throughflow, one characterized by the changed variables created by global warming.
"Now that we have a better understanding of how the Indonesian Throughflow responds to El Niño and La Niña variability, we can begin to understand how this current behaves in response to changes in the trade wind system that are brought on through anthropogenic climate change," Sprintall said. "Changes in the amount of warm water that is carried by the throughflow will have a subsequent impact on the sea surface temperature and so shift the patterns of rainfall in the whole Asian region."
The study, "The Indonesian seas and their role in the coupled ocean-climate system," appeared in the June 22 advance online publication of the journal Nature Geoscience.
In previous work over the past decade, Sprintall and colleagues from several countries have revised earlier thinking that most of the action in the throughflow was just at the surface where winds and waves interact. In fact, the flow often runs as much as 100 meters (328 feet) below the surface and features upwellings and other strong vertical flows of water. Model simulations have suggested that without this flow, the Indian Ocean would be generally colder at the surface as the Pacific would not be able to route warm water to it as efficiently.
These computer-generated scenarios have helped researchers forecast what could be happening as a consequence of human-caused climate change. Since the mid-twentieth century, scientists have noticed that Pacific Ocean tradewinds are weakening. The tradewinds help push Pacific Ocean water toward the throughflow and ultimately to the Indian Ocean. This corresponds to a predicted general slowdown of global thermohaline circulation – the flow of heat and salt around the world's oceans.
The researchers found that as a strong El Niño regime begun in the late 1990s slowly yielded to La Niña conditions in the middle of the following decade, the nature of the throughflow changed. The strongest currents became shallower and faster through the main component of the throughflow, the Makassar Strait that runs between the Indonesian islands of Kalimantan and Sulawesi.
La Niña and El Niño are characterized in part by the location of a warm pool of surface water in the Pacific Ocean. Warm water in the western Pacific near Indonesia is usually associated with La Niña and warm water in the eastern equatorial Pacific with El Niño.
The researchers said the study provides an important consideration that should guide the intense marine conservation efforts that are underway in Indonesia and neighboring countries. The nature of the throughflow has a direct influence on what nutrients get delivered to marine organisms in the region and in what quantity. The work also suggests that ongoing regular observations of what is happening in the throughflow are a necessity going forward.
Explore further: El Nino and La Nina explained
More information: "The Indonesian seas and their role in the coupled ocean–climate system." Janet Sprintall, et al. Nature Geoscience (2014) DOI: 10.1038/ngeo2188. Received 02 January 2014 Accepted 21 May 2014 Published online 22 June 2014
Journal reference: Nature Geoscience
Provided by University of Hawaii at Manoa
view popular
1 /5 (1 vote)
Tweet
Australia’s weather is influenced by warm water movements in the Pacific.
Credit: Flickr/Shayan USA, CC BY
View full size image
This article was originally published at The Conversation. The publication contributed the article to Live Science's Expert Voices: Op-Ed & Insights.
We wait in anticipation of droughts and floods when El Niño and La Niña are forecast but what are these climatic events?
The simplest way to understand El Niño and La Niña is through the sloshing around of warm water in the ocean.
The top layer of the tropical Pacific Ocean (about the first 200 metres) is warm, with water temperatures between 20C and 30C. Underneath, the ocean is colder and far more static. Between these two water masses there is a sharp temperature change known as the thermocline.
Winds over the tropical Pacific, known as the trade winds, blow from east to west piling the warm top layer water against the east coast of Australia and Indonesia. Indeed, the sea level near Australia can be one metre higher than at South America.
Warm water and converging winds near Australia contribute to convection, and hence rainfall for eastern Australia.
La Niña.
Credit: US National Weather Service.View full size image
In a La Niña event, the trade winds strengthen bringing more warm water to Australia and increasing our rainfall totals.
El Niño.
Credit: US National Weather Service.View full size image
In an El Niño the trade winds weaken, so some of the warm water flows back toward the east towards the Americas. The relocating warm water takes some of the rainfall with it which is why on average Australia will have a dry year.
In the Americas El Niño means increased rainfall, but it reduces the abundance of marine life. Typically the water in the eastern Pacific is cool but high in nutrients that flow up from the deep ocean. The warm waters that return with El Niño smother this upwelling.
Have El Niño and La Niña always been around?
El Niño and La Niña are a natural climate cycle. Records of El Niño and La Niña go back millions of years with evidence found in ice cores, deep sea cores, coral and tree rings.
El Niño events were first recognised by Peruvian fisherman in the 19th century who noticed that warm water would sometimes arrive off the coast of South America around Christmas time.
Because of the timing they called this phenomenon El Niño, meaning “boy child”, after Jesus. La Niña, being the opposite, is the “girl child”.
Predicting El Niño and La Niña
Being able to predict an El Niño event is a multi-million, possibly billion dollar question.
The drought hit Wagga Wagga, NSW, in 2006.
Credit: Flickr/John Schilling, CC BY-NC-NDView full size image
Reliably predicting an impending drought would allow for primary industries to take drought protective action and Australia to prepare for increased risk of dry, hot conditions and associated bushfires.
Unfortunately each autumn we hit a “predictability barrier” which hinders our ability to predict if an El Niño might occur.
In autumn the Pacific Ocean can sit in a state ready for an El Niño to occur, but there is no guarantee it will kick it off that year, or even the next.
Nearly all El Niños are followed by a La Niña though, so we can have much more confidence in understanding the occurrence of these wet events.
A variety of events
Predictability would be even easier if all El Niños and La Niñas were the same, but of course they are not.
Not only are the events different in the way they manifest in the ocean, but they also differ in the way they affect rainfall over Australia – and it’s not straightforward.
The exceptionally strong El Niños of 1997 and 1982 have now been termed Super El Niños. In these events the trade winds weaken dramatically with the warm surface water heading right back over to South America.
Recently a new type of El Niño has been recognised and is becoming more frequent.
This new type of El Niño is often called an “El Niño Modoki” – Modoki being Japanese for “similar, but different”.
In these events the warm water that is usually piled up near Australia heads eastward but only makes it as far as the central Pacific. El Niño Modoki occurred in 2002, 2004 and 2009.
(a) Australian rainfall in 1998 La Niña (May 1998 to March 1999), (b) the 1997 Super El Niño (April 1997 to March 1998), (c) the 1982 Super El Niño (April 1982 to February 1983) and (d) the 2002 El Niño Modoki (March 2002 to January 2003).
Credit: © Bureau of MeteorologyView full size image
Australian rainfall is affected by all its surrounding oceans. El Niño in the Pacific is only one factor.
As a general rule though, the average rainfall in eastern and southern Australia will be lower in an El Niño year and higher in a La Niña. The regions that will experience these changes and the strength are harder to pinpoint.
El Niño and climate change
It is not yet clear how climate change will affect El Niño and La Niña. The events may get stronger, they may get weaker or they may change their behaviour in different ways.
Some research is suggesting that Super El Niños might become more frequent with climate change, while others are hypothesising that the recent increase in El Niño Modoki is due to climate change effects already having an impact.
Because climate change in general may decrease rainfall over southern Australia and increase potential evaporation (due to higher temperatures) then it would be reasonable to expect that the drought induced by El Niño events will be exacerbated by climate change.
Given that we are locked into at least a few degrees of warming over the coming century, it’s hard not to fear more drought and bushfires for Australia.
Jaci Brown does not work for, consult to, own shares in or receive funding from any company or organisation that would benefit from this article, and has no relevant affiliations.
This article was originally published on The Conversation. Read the original article. Follow all of the Expert Voices issues and debates — and become part of the discussion — on Facebook, Twitter and Google +. The views expressed are those of the author and do not necessarily reflect the views of the publisher. This version of the article was originally published on Live Science.
استاد اميرمحسن حتما اين لينك را بخوانيد
http://www.undercurrentnews.com/201...emperatures-evidence-an-irreversible-el-nino/
http://www.undercurrentnews.com/201...emperatures-evidence-an-irreversible-el-nino/
بررسی روابط شاخص نوسان جنوبی و دمای سطح آب اقيانوسهای آرام و هند با بارش فصلی و ماهانه ايران
نويسندگان: ربانه روغنی، سعيد سلطانی* ، حسين بشری
نوع مطالعه: پژوهشي | موضوع مقاله: عمومی
چکيده مقاله:
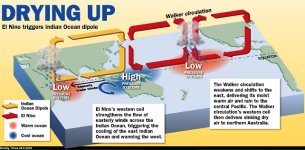
هم اكنون IOD منفى ست ولى طبق پيش بينى ها مثبت خواهد شد
http://uijs.ui.ac.ir/jgr/browse.php?a_id=405&slc_lang=fa&sid=1&ftxt=1
IOD هم مثل انسو
مولفه اتمسفرى و مولفه اقيانوسى داره
نويسندگان: ربانه روغنی، سعيد سلطانی* ، حسين بشری
نوع مطالعه: پژوهشي | موضوع مقاله: عمومی
چکيده مقاله:
شاخص نوسان جنوبی (Southern Oscillation Index, SOI) و الگوهای دمای سطح آب اقيانوس (Sea Surface Temperature, SST) بر بارش بسياری از مناطق جهان تأثيرگذار است. در اين پژوهش، روابط ميان بارش ماهانه و فصلی ايران با SOI و SST اقيانوسهای آرام و هند بررسی شد. برای اين منظور، از دادههای ماهانه بارش 50 ايستگاه سينوپتيک در ايران استفاده شد. به کمک نرمافزار Rainman سری فصلی و ماهانه بارش هر ايستگاه با چهار روش (ميانگين SOI، فازهای SOI، فازهای SST اقيانوس آرام و فازهای SST اقيانوس هند) با در نظر گرفتن زمانپيشی (Lead-time) صفر الی سه ماه، به گروههای مختلف تقسيم گرديد و اختلافات ميان گروههای بارش به کمک آزمونهای آماری ناپارامتری کروسکال- واليس و کلموگروف- اسميرنف تحليل شد. صحت استفاده از روابط معنیدار در پيشبينی احتمالی بارش ايران به کمک آزمون LEPS (Linear Error in Probability Space) برآورد شد. نتايج نشان داد که شاخص SOI در فصل تابستان (ژوئيه - سپتامبر) بهطور غيرهمزمان با بارشهای ماه اکتبر (مهر) و پائيزه (اکتبر- دسامبر) در نواحی غرب و شمالغرب ايران و سواحل غربی دريای خزر رابطه معنیدار و پايداری دارد. بهطوریکه فازهای النينو (منفی) و لانينا (مثبت) اغلب بهترتيب با افزايش و کاهش بارش در اين نواحی همراه هستند. استفاده از ميانگين SOI جهت پيشبينی بارش نواحی ذکر شده مناسب است، اما الگوهای SST اقيانوسهای آرام و هند بهدليل رابطه ضعيف با بارش ايران و يا ناپايداری روابط، جهت پيشبينی بارشهای ايران مناسب به نظر نمیرسند. بنابراين به دليل اينکه بارشهای ايران در تمامی فصول تنها در ارتباط با شاخص SOI و SST اقيانوسهای آرام و هند نمیباشند، نرمافزار Rainman به عنوان ابزاری جامع برای مديريت منابع آب ايران در کليه فصول سال به شمار نمیآيد. پيشنهاد میشود تأثير دور ساير نوسانات اقيانوسی- اتمسفری با بارش ايران بررسی شود و براساس شاخصهای نوسانات مؤثر بر بارش ايران، مدلی شبيه Rainman برای پيشبينی بارش ايران تهيه شود.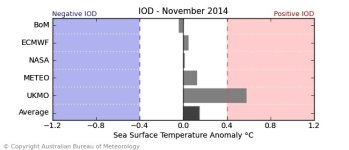

هم اكنون IOD منفى ست ولى طبق پيش بينى ها مثبت خواهد شد
http://uijs.ui.ac.ir/jgr/browse.php?a_id=405&slc_lang=fa&sid=1&ftxt=1
IOD هم مثل انسو
مولفه اتمسفرى و مولفه اقيانوسى داره
Amir Mohsen
متخصص بخش هواشناسی
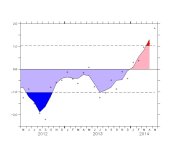
دوستان عزیزی که علاقمند هستند نوسانات PDO رو مورد بررسی قرار بدن در لینک زیر میتونند به این مهم دست پیدا کنند و در اخرین آپدیت ماهانه این شاخص که در ماه MAY 2014 منتشر شده این شاخص 1.80+ بوده :
http://jisao.washington.edu/pdo/PDO.latest
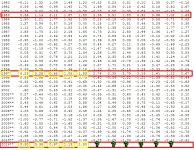
جالب هست بدونید سالهای مشابه با MAY 2014 بشرح ذیل هست:
1936= 1.83+
1983=1.80+
1987=1.85+
1997=1.83+
2005=1.86+
2014=1.80+
http://jisao.washington.edu/pdo/PDO.latest
جالب هست بدونید سالهای مشابه با MAY 2014 بشرح ذیل هست:
1936= 1.83+
1983=1.80+
1987=1.85+
1997=1.83+
2005=1.86+
2014=1.80+
Amir Mohsen
متخصص بخش هواشناسی
Strong odds El Nino weather event to return by end of year: UN
Enrique Lagunas digs a trench to redirect water toward a street in Laguna Beach, Calif. after heavy rains from an El Nino storm hit Southern California, Wednesday, March 25, 1998. (AP / Orange County Register, Bruce Chambers)
Share:
Text:
(0)
John Heilprin, The Associated Press
Published Thursday, June 26, 2014 6:48AM EDT
GENEVA -- There's a strong chance an El Nino weather event will reappear before the end of the year and shake up climate patterns worldwide, the UN weather agency said Thursday.
The El Nino, a flow of unusually warm surface waters from the Pacific Ocean toward and along the western coast of South America, changes rain and temperature patterns around the world and usually raises global temperatures.
An update Thursday from the Geneva-based World Meteorological Organization puts the odds of El Nino at 60 per cent between June and August, rising to 75-80 per cent between October and December. It said the expected warming would come on top of the effects of man-made global warming.
RELATED STORIES
Eastern Canada could see below-average hurricane season
El Nino will warm Canada this year, expert predicts
"El Nino leads to extreme events and has a pronounced warming effect," said WMO Secretary-General Michel Jarraud. "It is too early to assess the precise impact on global temperatures in 2014, but we expect the long-term warming trend to continue as a result of rising greenhouse gas concentrations."
The outlook is for El Nino to reach peak strength during the last quarter of the year and into the first few months of 2015 before dissipating.
Tropical Pacific Ocean temperatures have already warmed to weak El Nino levels, but the weather event hasn't fully established itself yet based on readings of other conditions such as sea level pressure, cloudiness and trade winds, the report said.
Rupa Kumar Kolli, chief of a WMO division that deals with climate prediction and adaptation, said the El Nino would likely have moderate strength, but there remains a wide range of possibilities.
"We are expecting about the same levels" as the last El Nino from 2009 to 2010, which was the hottest year on record, he said.
Read more: http://www.ctvnews.ca/sci-tech/stro...urn-by-end-of-year-un-1.1887001#ixzz35knahgk7

