-
توجه: در صورتی که از کاربران قدیمی ایران انجمن هستید و امکان ورود به سایت را ندارید، میتوانید با آیدی altin_admin@ در تلگرام تماس حاصل نمایید.
You are using an out of date browser. It may not display this or other websites correctly.
You should upgrade or use an alternative browser.
You should upgrade or use an alternative browser.
مباحث عمومی هواشناسی
- شروع کننده موضوع Amir Mohsen
- تاریخ شروع
- وضعیت
- موضوع بسته شده است.
'
هاهاهاهاهاهاهاها .......... :خنده2:
چه جالب!!!
ظاهرا صحبت هاي من هميشه با حالات بيشتر دوستان رابطه عكس داره!!! :93: :نیش:
چه هنگامي كه صحبت از دوران خشكي و سختي ميشه اين رابطه معكوس مشهود ميشه!!!icestar
و البته زماني كه صحبت از سرسبزي و آمار بارش سالانه ميشه هم همينطور هست!!!!!!!!!103

.......... :غش:
ولي خب اين چقدر خوبه كه انجمن دوباره براي مدتي جان دوباره اي گرفت .... هاهاهاهاهاهاهاها :نیش:
:گل:


mehrdad_teh
متخصص بخش هواشناسی
آمار بارش سال شمسي تهران در 9 سال اخير
83 : 576 ترسال
84: 453.5 نرمال
85: 398.1 خشكسال
86: 433 نرمال
87: 235 خشكسال
88: 277.3 خشكسال
89: 316.2 خشكسال
90: 563.6 ترسال
91: 521.7 ترسال
aria_tehran
کاربر ويژه
اگه باز ضدحال نزنهابر های تندری بارشی در راه تهران . دیگه امروز بارش 100 درصده
دیشب اون همه ابر بود همشون موقع رسیدن به تهران از بین میرفتن!!
mehrdad_teh
متخصص بخش هواشناسی
اینا اقدسیه بود ؟
yes sir
آمار بارش سال شمسي تهران در 9 سال اخير
83 : 576 ترسال
84: 453.5 نرمال
85: 398.1 خشكسال
86: 433 نرمال
87: 235 خشكسال
88: 277.3 خشكسال
89: 316.2 خشكسال
90: 563.6 ترسال
91: 521.7 ترسال
اینم بارانسنجی درکه :
83 : 596.0
84 : 438.0
85 : 426.5
aria_tehran
کاربر ويژه
navid-mashhad
کاربر ويژه
سلام
امروز هوا عالیه:گل: صبح تو کوه ها مه بود
[h=4]
+19 °C
 15 kmh
Cloudy
Feels Like: +19°
Barometer: 1021.0 hPa
Dewpoint: +6°
Humidity: 42.5%
Visibility: 10 km
امروز هوا عالیه:گل: صبح تو کوه ها مه بود
[h=4]
+19 °C

Cloudy
Feels Like: +19°
Barometer: 1021.0 hPa
Dewpoint: +6°
Humidity: 42.5%
Visibility: 10 km
navid-mashhad
کاربر ويژه
92 ناهنجار
Banned
mehrdad_teh
متخصص بخش هواشناسی
فاجعه عظيم در اوكلاهاما آمريكا / تورنادوي مهيب با سرعت بيش از 300 كيلومتر در ساعت
اوكلاهاما با خاك يكسان شد !!!!!!!
91 كشته كه 20 نفر از اونها كودك بودند
اوكلاهاما با خاك يكسان شد !!!!!!!
91 كشته كه 20 نفر از اونها كودك بودند
navid-mashhad
کاربر ويژه
این تورنادو در 14 سال اخیر بی سابقه بوده
دولت ایالات متحده شرایط اوکلاهاما رو فاجعه اعلام کرد!!
دولت ایالات متحده شرایط اوکلاهاما رو فاجعه اعلام کرد!!
mohammadsadat
کاربر ويژه
با اجازه فولادی عزیز.
محمد جان اگه منظورت عکسایی هست که کاربرا میزارن باید با قند شکن بری تا بتونی ببنیشون چون سایت Panorama ک عکسارو توش آپ میکنن شیلتره.
سجاد جان راه دیگه ای نداره مثلاً عکس ها رو روی یه نرم افزار نذاشتن یا تو ورژن های جدید رو خود گوگل ارث؟
میتونی یه قندشکن خوب بهم معرفی کنی در حد دیدن عکس های گوگل ارث
تا باشه از این فاجعه ها،خیلی باحاله اینطور طوفان ها واقعا هیجان انگیزهاین تورنادو در 14 سال اخیر بی سابقه بوده
دولت ایالات متحده شرایط اوکلاهاما رو فاجعه اعلام کرد!!
راستی قیمت دارو چرا اینقد بی حیا شده امروز رفتم داروخونه مخم سوت کشید از این قیمتها
ali.doosti
کاربر ويژه
سلام
ممنون محمدجان بابت تبریکت:گل:
هوا نیمه ابریه ولی ابریه تابستونی!!!
ممنون محمدجان بابت تبریکت:گل:
هوا نیمه ابریه ولی ابریه تابستونی!!!
Amir Mohsen
متخصص بخش هواشناسی
Atlantic and Pacific Tropical Outlook: First Month
Since we last updated you in Mid-April on the state of the tropics, a lot more has come together and is giving us a look at what the first half of the season will hold, as well as what regions are going to be at the highest risk. Of course, with any prediction we make will be supported with evidence and this update we will use four main components that will define tropical activity in general for the first half of the season.
The four elements are:
However, this year the models used to calculate ENSO are showing that there will not be a La-Nina or an El-Nino, but a neutral phase of ENSO. Probability plumes for the forecast period (IRI/CPC Plumes) show a dominant probability plume of a Neutral Phase. Judging by climatological averages, this means that there will be close to average hurricane numbers for each region.
For the Atlantic, we note that there is above average SST Anomalies off the coast of Africa, and there is a little “tail” extending up the Eastern Seaboard. This is caused by the Gulf Stream current, which is a current that takes warm water from the Caribbean and transports it Northward. This could “bait” hurricanes to move alongside the Eastern Seaboard, although nothing like Sandy is being predicted in this analysis.
Key:
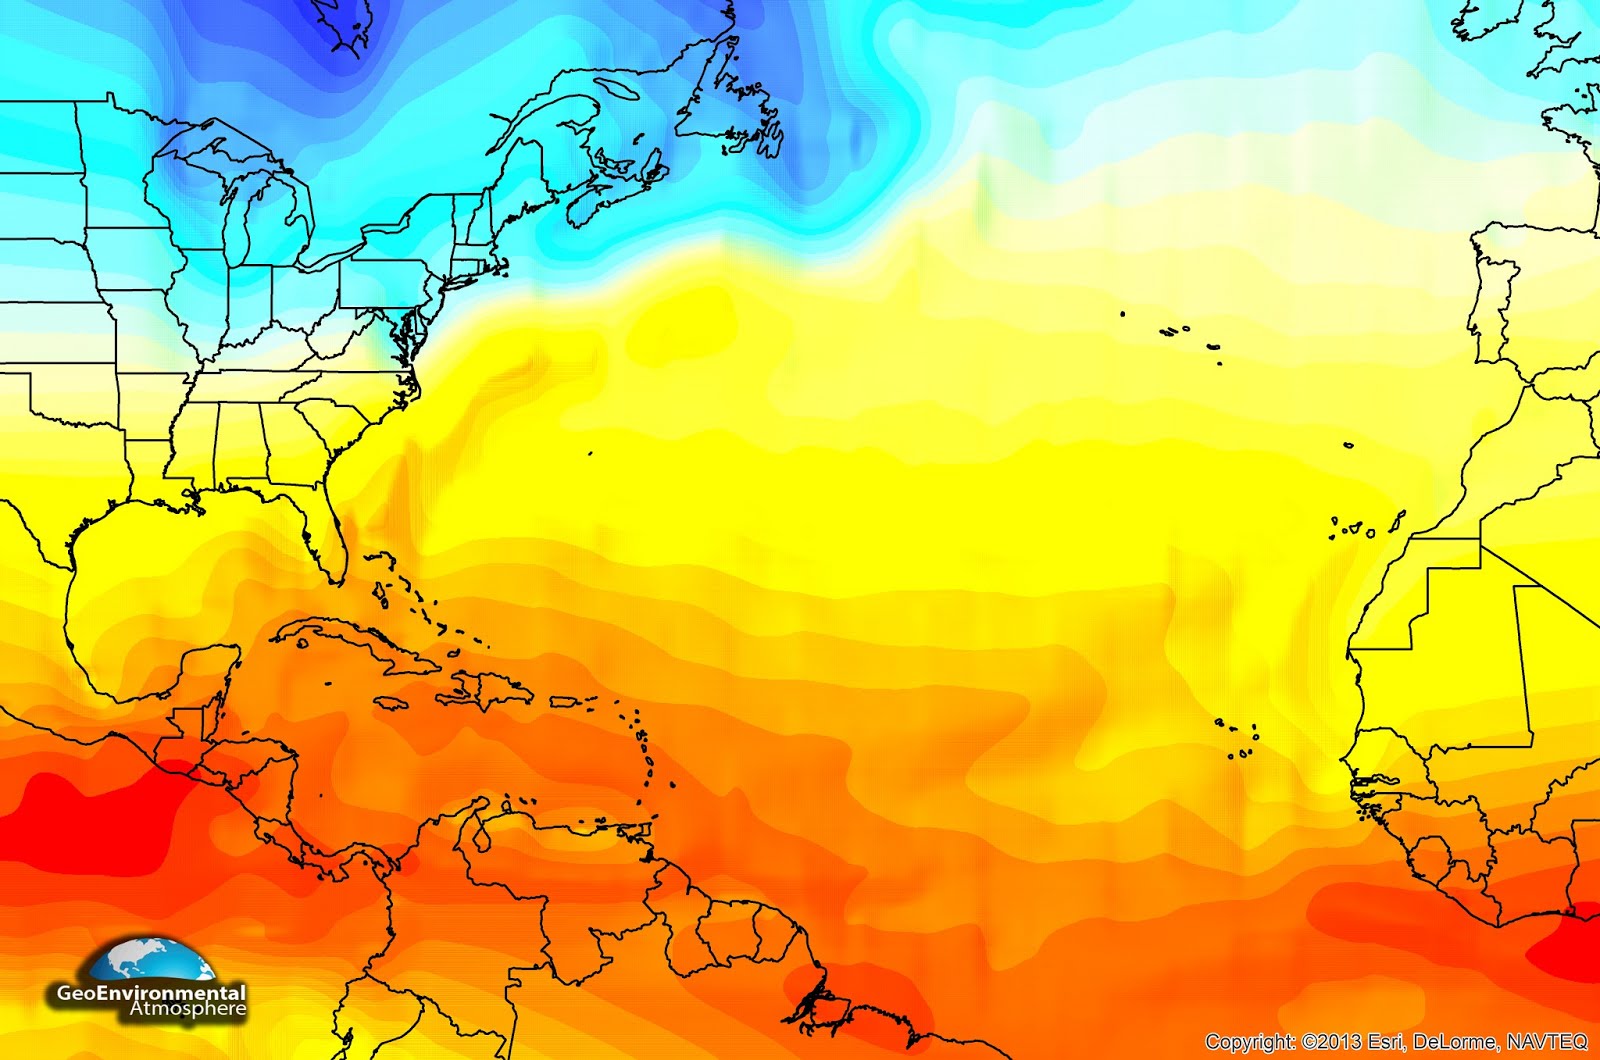
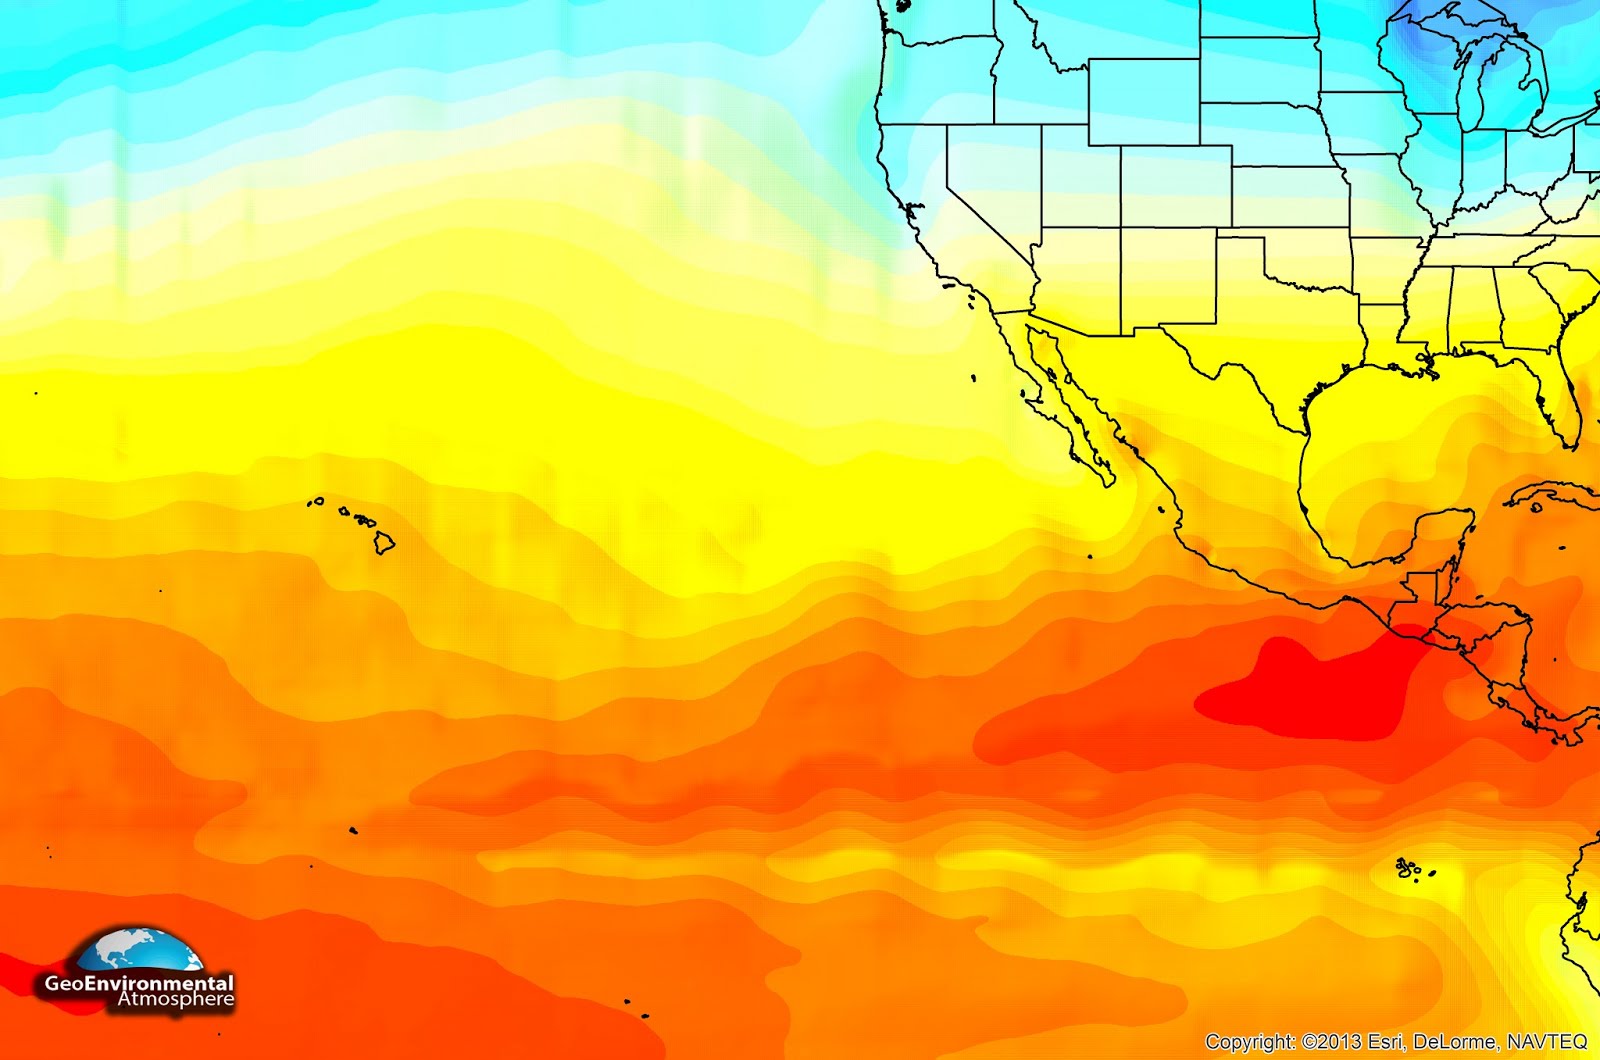
In the Pacific, one finds that there are warmer anomalies off the Central American coast, which increases the chances for cyclone development in that region. However, the reason that there is a Neutral phase of ENSO is for the small sliver of yellow off the South American coast, which is right smack dab in the middle of the regions that ENSO is calculated in.
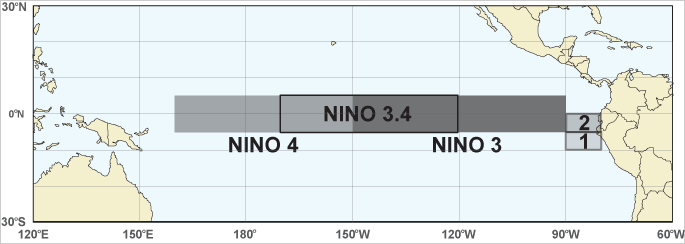
The temperatures in that region are for the majority neutral, so therefore we have a neutral ENSO phase for the time being.
 Madden Juilian Oscillation
We would like to start with the large features, and perhaps the most important factor in determining the “availability” of the atmosphere is that of the Madden-Julian Oscillation (MJO). The name sounds scary, but understanding this oscillation is not. Simply speaking, the element of the MJO that we want to pay the most attention to is a measurement of the movement of convection (rising air) around the equator in the Indian and Pacific Oceans. That rising air has in general a larger moisture content than around it, which supports the convection throughout the atmosphere (through 200 Millibars). This longwave pattern repeats itself on a period of 30-60 days (meaning that the favorable area crosses Hawaii roughly once every one to two months). However, the favorable area is very large in size and it takes a couple weeks to completely move through Hawaii. If one of these waves moves into a region of lower pressure, it could trigger a cyclone to develop, and if the conditions are right, develop into a tropical system.
 The image above is that of the 500 Millibar Vorticity. The darker colors show the higher values and indicate the presence of a low pressure system. This is important as we see an active, progressive pattern in the Pacific, which is evident of an inactive MJO pattern. (Current deterministic modeling of the MJO places it into the “Circle of Death” with varying re-emergence locations between the models. However, judging by this image alone, we see a lack of development in the prime regions for cyclones to start off, but that does not mean that the whole season will be that way.
[h=3]Trough and Ridge Setup at 18,000 Feet Another factor to see where the general areas of lower pressure (troughs), and higher areas of pressure (ridges) are in the atmosphere is in the mid-levels of it, at approximately 18,000 feet. This is an important level of the atmosphere because the mid-sections of tropical systems reside there, and that level also steers some of the features around via wind patterns. The general rule is for an area of lower pressure is that it is more favorable for tropical development, whereas a higher pressure area tends to house a lower chance for tropical development.
 When an MJO pattern is non-influential in the global weather pattern, the troughs and ridges in the region suddenly become highly deterministic of the setup and who gets what weather. We see in the image below that there is a trough in the Northeastern Pacific. However, where the tropical cyclones have the highest chance of forming near the Equator, there are higher heights than unusual, meaning that the chances that tropical cyclones develop within the next three weeks is unlikely. However, the team is confident that this setup will eventually dissolve and combine with the re-emerging MJO pattern to produce a conducive environment for development in the Pacific region.
 The Atlantic Basin presents an interesting setup. To begin, we have a region of lower heights located in the United States, and extending into the Gulf of Mexico. We also have a high pressure system in the Central and Eastern portions of the Atlantic Ocean, and also one southwest of Iceland. The high pressure system southwest of Iceland will help to slow down troughs and force them south, whereas the high pressure systems out in the Atlantic will allow for a lower frequency of systems to develop.
[h=3] Subtropical Jet – A Huge Moisture Source Another factor is the subtropical jet, which runs right above the Equator, and constantly funnels tropical moisture across the Pacific Ocean into the Caribbean. Think of this like a giant atmospheric hose, which moves moisture that can be picked up by a strengthening low pressure system to help it intensify. Upper level low pressure systems can also be drawn toward this source and interact with other atmospheric mechanisms to spur up some development in both the Atlantic and the Pacific Oceans.
Key: (The light green shows a dry airmass, dark green indicates a moist airmass, and the shades of blue indicate a near-saturated or saturated air mass.)
 The relative humidity content for the Pacific ocean shows a similar story for a lower number of tropical cyclones. We see that the highest humidity values in the Pacific ocean are located near the area that has a trough (which does little for the tropical regions). However, please turn your attention to the darker areas of green between Hawaii and the Gulf of Mexico. That is a sign of the sub-tropical jet trying to become moisture-laden. Over time as the season progresses and the general high pressure pattern relaxes the sub-tropical jet stream will supply an abundant moisture source for developing cyclones. In simple terms, the subtropical jet is about to awake from its slumber, and make up for lost time.
 What may be a harbinger of things to come for the Atlantic Ocean and the Gulf of Mexico is the moisture in the central United States that spans the country from North to South. Another trough and associated cold-front can be found off the Eastern Seaboard in the Atlantic Ocean. This moisture is most likely presented in the form of a trough(s), and all sorts of atmospheric dynamics such as upper level lows, tropical upper tropospheric troughs, and upper level low pressure systems like to reside around troughs.
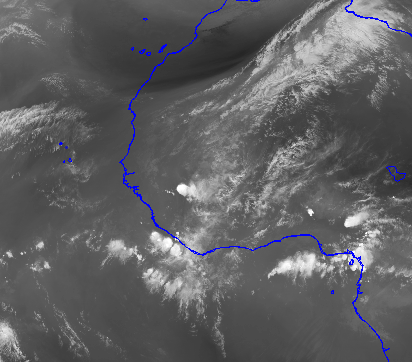
[h=3]Saharan Dust Layer – An Atlantic Special The Saharan Dust layer is an expansive region of very dry and dusty air that is located off the coast of Africa. It is a region in which it frequently squanders tropical waves (weak areas of low pressure) that travel west from the African Coast near the Cape Verde Islands. The magnitude of this dust layer can play a big role in the number of tropical waves that survive off the coast, and can affect the number of tropical systems the Atlantic sees. Below is a satellite image of the layer.
 Thank you for reading this outlook for the first couple months of the season. Soon, we will release out outlook with a quantitative analysis of the season. You are welcome to disseminate, quote and reference this update at any time with a link provided to this sole article as credit to the team!
(Disclaimer: This is a long range outlook. That being said, there are many unpredictable factors that may come together and produce an anomaly that will not be forecasted. We can only blame this on the chaotic motion of the atmosphere, which cannot be modeled with 100% accuracy. Therefore, please refrain from using this outlook to make any plans which are significant to you or others.
Since we last updated you in Mid-April on the state of the tropics, a lot more has come together and is giving us a look at what the first half of the season will hold, as well as what regions are going to be at the highest risk. Of course, with any prediction we make will be supported with evidence and this update we will use four main components that will define tropical activity in general for the first half of the season.
The four elements are:
- Sea Surface Temperature Anomalies (ENSO)
- Madden Julian Oscillation (MJO)
- 500 MB Height Anomalies (Troughs and Ridges)
- Subtropical Jet
However, this year the models used to calculate ENSO are showing that there will not be a La-Nina or an El-Nino, but a neutral phase of ENSO. Probability plumes for the forecast period (IRI/CPC Plumes) show a dominant probability plume of a Neutral Phase. Judging by climatological averages, this means that there will be close to average hurricane numbers for each region.
For the Atlantic, we note that there is above average SST Anomalies off the coast of Africa, and there is a little “tail” extending up the Eastern Seaboard. This is caused by the Gulf Stream current, which is a current that takes warm water from the Caribbean and transports it Northward. This could “bait” hurricanes to move alongside the Eastern Seaboard, although nothing like Sandy is being predicted in this analysis.
Key:
- Blue: Colder Anomalies
- White and Yellow: Neutral
- Orange and Red: Warmer SST Anomalies
In the Pacific, one finds that there are warmer anomalies off the Central American coast, which increases the chances for cyclone development in that region. However, the reason that there is a Neutral phase of ENSO is for the small sliver of yellow off the South American coast, which is right smack dab in the middle of the regions that ENSO is calculated in.
The temperatures in that region are for the majority neutral, so therefore we have a neutral ENSO phase for the time being.
We would like to start with the large features, and perhaps the most important factor in determining the “availability” of the atmosphere is that of the Madden-Julian Oscillation (MJO). The name sounds scary, but understanding this oscillation is not. Simply speaking, the element of the MJO that we want to pay the most attention to is a measurement of the movement of convection (rising air) around the equator in the Indian and Pacific Oceans. That rising air has in general a larger moisture content than around it, which supports the convection throughout the atmosphere (through 200 Millibars). This longwave pattern repeats itself on a period of 30-60 days (meaning that the favorable area crosses Hawaii roughly once every one to two months). However, the favorable area is very large in size and it takes a couple weeks to completely move through Hawaii. If one of these waves moves into a region of lower pressure, it could trigger a cyclone to develop, and if the conditions are right, develop into a tropical system.
[h=3]Trough and Ridge Setup at 18,000 Feet Another factor to see where the general areas of lower pressure (troughs), and higher areas of pressure (ridges) are in the atmosphere is in the mid-levels of it, at approximately 18,000 feet. This is an important level of the atmosphere because the mid-sections of tropical systems reside there, and that level also steers some of the features around via wind patterns. The general rule is for an area of lower pressure is that it is more favorable for tropical development, whereas a higher pressure area tends to house a lower chance for tropical development.
[h=3] Subtropical Jet – A Huge Moisture Source Another factor is the subtropical jet, which runs right above the Equator, and constantly funnels tropical moisture across the Pacific Ocean into the Caribbean. Think of this like a giant atmospheric hose, which moves moisture that can be picked up by a strengthening low pressure system to help it intensify. Upper level low pressure systems can also be drawn toward this source and interact with other atmospheric mechanisms to spur up some development in both the Atlantic and the Pacific Oceans.
Key: (The light green shows a dry airmass, dark green indicates a moist airmass, and the shades of blue indicate a near-saturated or saturated air mass.)
[h=3]Saharan Dust Layer – An Atlantic Special The Saharan Dust layer is an expansive region of very dry and dusty air that is located off the coast of Africa. It is a region in which it frequently squanders tropical waves (weak areas of low pressure) that travel west from the African Coast near the Cape Verde Islands. The magnitude of this dust layer can play a big role in the number of tropical waves that survive off the coast, and can affect the number of tropical systems the Atlantic sees. Below is a satellite image of the layer.
The air off the western African Coast is dry, which is a result of the higher pressure over those areas and the Saharan Dust Layer. This will challenge and help to prevent tropical waves that are moving off Africa to develop into Tropical Systems. However, that is not to say that there will be no activity and development, it will only be less than normal for the forecast period. Judging by a satellite loop of this region, we see that there is a developing mass of dry air that is helping to weaken the wetter regions of the atmosphere, including the convective activity. However, this will need to be monitored to see how dry this airmass gets and where it exactly sets up. We have high confidence that the layer will develop, as model guidance points to an area of high pressure developing over where the tropical waves exit the region.
[h=3]In Conclusion… So, what does this all mean in summary? This means expect a relatively slow start to the first half of the tropical season, with the biggest areas for development located in the Atlantic Ocean near the Eastern Seaboard and the Caribbean. The season will most likely get off to a slow start, but by the end of July will near average frequency and cyclonic intensity.(Disclaimer: This is a long range outlook. That being said, there are many unpredictable factors that may come together and produce an anomaly that will not be forecasted. We can only blame this on the chaotic motion of the atmosphere, which cannot be modeled with 100% accuracy. Therefore, please refrain from using this outlook to make any plans which are significant to you or others.
- وضعیت
- موضوع بسته شده است.


